Bitcoin Price Prediction: Unveiling Crucial Market Shifts on 10/13

The cryptocurrency market recently faced significant turbulence. A brutal market dip on Friday, triggered by US President Donald Trump’s tariff announcement on China, caused widespread liquidations. Approximately $20 billion was wiped out in 24 hours, according to CoinGlass data. This event flushed out highly leveraged traders. However, a rebound has now begun, attracting stronger long-term investors. Many observers are now closely watching the charts for a clear **Bitcoin price prediction** and insights into other major assets.
Crucial Crypto Market Analysis: Post-Dip Recovery
Following the sharp declines, Bitcoin and major altcoins witnessed solid buying at lower levels. This suggests a foundational demand exists in the market. Despite the bounce, a sustained relief rally appears unlikely in the immediate term. Bears are expected to sell at higher price points. Consequently, Bitcoin and select altcoins could experience rangebound action for several days. Economist Timothy Peterson suggested BTC might enter a “cooling off period” for three to four weeks. Afterwards, it could resume its uptrend, albeit at a slower pace. Investors are asking: can BTC and altcoins build on this recovery? Or will higher levels attract renewed selling pressure? This comprehensive **crypto market analysis** will explore the charts of top cryptocurrencies to provide clarity.
Macro Indicators: S&P 500 and US Dollar Index
Broader market movements often influence cryptocurrency trends. The S&P 500 Index (SPX) turned down sharply on Friday. It broke below the 20-day exponential moving average (6,652). This indicated profit-booking by traders. Bulls, however, purchased the dip to the 50-day simple moving average (6,538). They have since pushed the price back towards the 20-day EMA. If the price sharply declines from the 20-day EMA, bears will attempt to sink the index below the 50-day SMA. A successful break could deepen the correction to 6,350, then to 6,200. Conversely, a close above the 20-day EMA would signal the correction’s end. The index might then retest its all-time high of 6,764.
The US Dollar Index (DXY) closed above its moving averages on Tuesday. This signaled that bears were losing control. Bulls pushed the price above the downtrend line on Thursday. Yet, they have struggled to build on this breakout. Sellers will likely try to push the price below the 20-day EMA (98.26). This is a critical short-term level. A strong bounce off the 20-day EMA increases the chance of a break above 100.50. The index could then climb to the 102 level. Conversely, a close below the moving averages suggests rejection of the downtrend line break. The index may then tumble to 97, and later to the strong support at 96.21.

Crypto market data daily view. Source: Coin360
Bitcoin Price Prediction: A Look at BTC’s Recovery
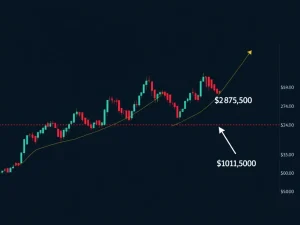
Sellers failed to complete a double-top pattern for BTC. They could not achieve a close below the $107,000 support level. The Bitcoin price dipped to $102,000 on Friday. However, it quickly made a sharp recovery. This indicates strong buying interest at lower levels. The BTC/USDT pair is expected to face selling pressure near the 61.8% Fibonacci retracement level of $116,955. Nevertheless, if buyers overcome this resistance, the pair could rally to $121,020. It might then target the all-time high of $126,199. Conversely, if the price turns down sharply from its current level, it will likely find support at $109,500. Further support lies at $107,000. Buyers are expected to fiercely defend the $107,000 level. A break below it increases the risk of a collapse below $100,000. This is a key area for our ongoing **Bitcoin price prediction**.

BTC/USDT daily chart. Source: Crypto News Insights/TradingView
Key Altcoin Predictions: Ethereum, BNB, and XRP
Several altcoins have also shown notable movements post-dip. Understanding their individual dynamics is crucial for comprehensive **altcoin predictions**.
Ethereum Price: Navigating the Channel
Sellers pulled Ether (ETH) below its descending channel pattern on Friday and Saturday. However, they could not sustain these lower levels. The **Ethereum price** climbed back into the channel on Sunday. This indicates solid demand. If the price sharply turns down from the moving averages, bears will again try to pull the ETH/USDT pair below the channel. Success here would suggest a near-term top. Conversely, if the price breaks above the moving averages, the pair may remain inside the channel longer. A break and close above the resistance line improves prospects for a resumed uptrend.

ETH/USDT daily chart. Source: Crypto News Insights/TradingView
BNB’s Volatility: New Highs and Resistance
BNB (BNB) experienced significant volatility recently. Bears pulled the price below the 20-day EMA ($1,145) on Friday. Bulls, however, reclaimed this level on Saturday. This suggests positive sentiment. Dips are seen as buying opportunities. The BNB price galloped to a new all-time high of $1,375 on Monday. Still, bulls are struggling to sustain these higher levels. This indicates selling on rallies. Bears will try to strengthen their position by pulling the price back below the 20-day EMA. If they succeed, it suggests a short-term top. Conversely, if the price rises and closes above $1,350, bulls remain in control. The BNB/USDT pair may then rally to $1,609.

BNB/USDT daily chart. Source: Crypto News Insights/TradingView
XRP Price: Recovery from the Plunge
XRP (XRP) completed a bearish descending triangle setup on Friday. It plunged well below its pattern target of $1.72. A minor positive is the solid recovery from the $1.25 low. This signals aggressive buying at lower levels. The relief rally for **XRP price** is expected to reach the 20-day EMA ($2.77). Here, bears are expected to step in. If the price turns down from the 20-day EMA, the XRP/USDT pair could slump to $2.20, and then to $2. Bulls must drive the price above the downtrend line to signal a comeback. Until then, rallies are likely to be sold into.

XRP/USDT daily chart. Source: Crypto News Insights/TradingView
Spotlight on Solana, Dogecoin, and Cardano in Altcoin Predictions
Beyond the major players, other altcoins also present interesting patterns for future **altcoin predictions**.
Solana’s Bounce: Bears vs. Bulls
Solana (SOL) fell below its ascending channel pattern on Friday. This indicated bears were attempting to take charge. Buyers, however, did not give up. They bought the dip to $168. This started a sharp recovery on Sunday. It pushed the SOL/USDT pair to the breakdown level from the channel. If the price turns down and breaks below $168, sentiment has turned negative. This increases the likelihood of a drop to $155. Bulls will re-enter the game after pushing the Solana price above the moving averages. The pair could then rally towards the overhead resistance of $260.

SOL/USDT daily chart. Source: Crypto News Insights/TradingView
Dogecoin’s Range: Consolidation Ahead
Sellers pulled Dogecoin (DOGE) below the $0.14 support level on Friday. Still, they could not achieve a close below it. The Dogecoin price recovered sharply. It re-entered the large $0.14 to $0.29 range. Bulls will try to push the price to the 20-day EMA ($0.23). This level could attract sellers. If the price falls below the 20-day EMA, the DOGE/USDT pair could decline to $0.18, then to $0.16. The next trending move might begin after the price closes above $0.29 or below $0.14. Until then, the pair will likely oscillate inside this range.

DOGE/USDT daily chart. Source: Crypto News Insights/TradingView
Cardano’s Challenge: Overcoming Resistance
Cardano (ADA) broke below its descending channel pattern on Friday. It plunged to a panic low of $0.27. Lower levels attracted strong buying from bulls. They have pushed the price back to the breakdown level from the channel. Sellers are expected to pose a strong challenge in the zone between the support line and the 20-day EMA ($0.78). If the Cardano price turns down sharply from this resistance zone, bears remain in control. The ADA/USDT pair could then drop to $0.60, and eventually to $0.50. This negative view will be invalidated in the near term if the price continues higher. A break above the resistance line would be a positive sign.

ADA/USDT daily chart. Source: Crypto News Insights/TradingView
Hyperliquid (HYPE): A Pattern Breakdown and Recovery
Hyperliquid (HYPE) completed a head-and-shoulders pattern on Friday. It plunged to its target objective of $21. Solid buying at lower levels has pushed the price back to the neckline of the H&S pattern. Here, bears are expected to mount a strong defense. If the price turns down from the neckline, sellers will try to sink the HYPE/USDT pair below the $35.50 support. If successful, the Hyperliquid price could descend to $30.50. Buyers, however, likely have other plans. They will try to push the price above the moving averages. This suggests that the corrective phase may be nearing completion.

HYPE/USDT daily chart. Source: Crypto News Insights/TradingView
This article does not contain investment advice or recommendations. Every investment and trading move involves risk. Readers should conduct their own research when making a decision.