Bitcoin Price: The Crucial CME Gap Threatens BTC’s $114K Support
The cryptocurrency market is buzzing with anticipation as Bitcoin price finds itself in a precarious position, caught between significant liquidity zones. For weeks, traders and analysts have observed BTC’s struggle to break free from a tight range, leaving many wondering: what’s next for the world’s leading digital asset? This deep dive explores the critical price levels, the persistent CME gap, and what this means for Bitcoin’s immediate future.
Understanding Bitcoin Price Consolidation: The Trapped Narrative
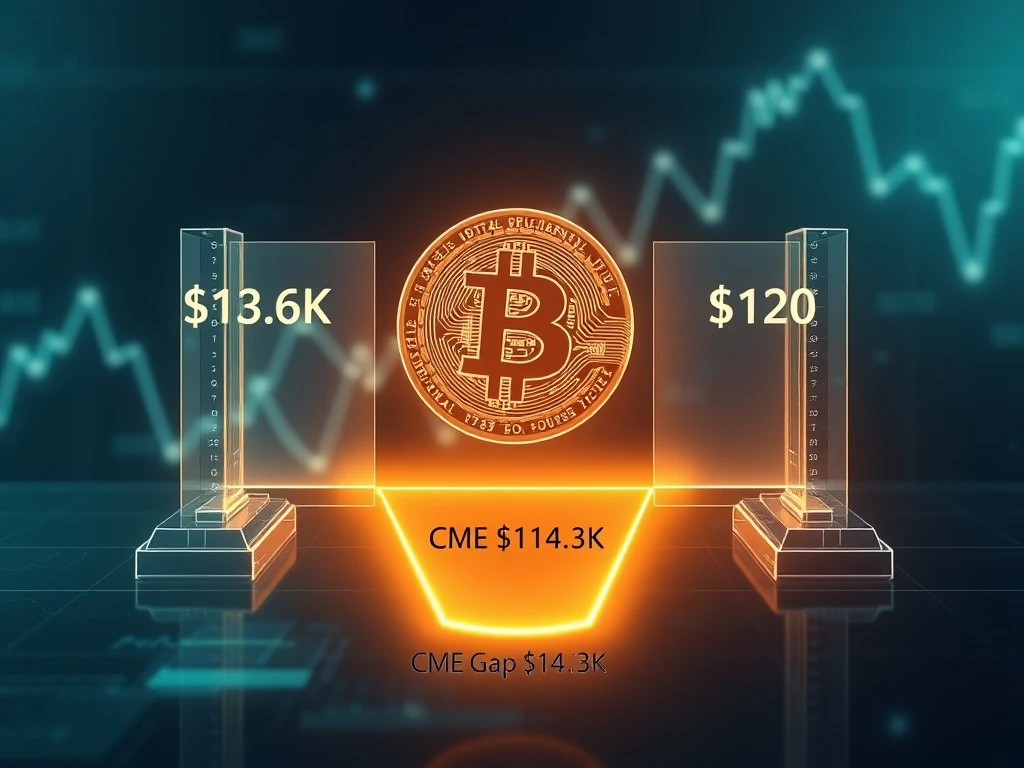
Bitcoin’s recent price action paints a clear picture of consolidation, with the asset oscillating between two pivotal areas: the lower cluster ranging from $113.6K to $114.5K and the upper cluster around $120K to $121K. This tight range indicates a standoff between bullish and bearish forces, with neither side able to establish clear dominance. Analysts like CrypNuevo highlight that this pattern of being ‘trapped’ is driven by historical liquidity levels, where significant buy and sell orders are clustered, creating strong support and resistance points.
- Lower Cluster ($113.6K–$114.5K): This zone acts as a critical support level. A breakdown here could signal a more significant downward move.
- Upper Cluster ($120K–$121K): This represents a formidable resistance. Previous attempts to push higher have stalled here, suggesting strong selling pressure.
- Pivotal Midpoint ($113.8K): According to CrypNuevo, this specific level within the lower cluster has historically acted as a key determinant for the next directional shift, indicating its importance for traders to monitor.
The Lingering Threat: What is the CME Gap and Why Does it Matter?
A significant factor contributing to the downward pressure on Bitcoin price is the unfilled CME gap at $114.3K. For those unfamiliar, a CME (Chicago Mercantile Exchange) gap occurs when Bitcoin’s closing price on the CME futures market on a Friday differs significantly from its opening price on Monday. These gaps often get ‘filled’ as price action tends to revisit these levels.
Despite repeated attempts, this particular gap has remained open by a few hundred dollars. Historical data suggests that such gaps often act as a magnet for price, reinforcing the likelihood of Bitcoin moving towards the lower cluster in the coming one to two weeks. This phenomenon is a key consideration for any Bitcoin forecast, as it introduces a gravitational pull towards a specific price point, regardless of other market catalysts.
Navigating Liquidation Clusters: A Battle for Direction
The interplay between these two prominent liquidation clusters and the CME gap is dictating Bitcoin’s immediate trajectory. Liquidation clusters represent areas where a large number of leveraged positions would be liquidated if the price moves against them. This creates significant liquidity, as forced buying or selling occurs. The current market structure suggests that liquidity is fairly evenly distributed between these clusters, leading to the oscillating pattern observed.
The formation of a long downside wick, following a series of upper wick rejections, further reinforces the expectation of a price revisit to the lower cluster. This pattern often indicates that buyers are stepping in at lower prices, but the overall market sentiment lacks the conviction for a sustained breakout. Traders must remain vigilant, as a decisive move below $113.6K or above $120K could trigger a cascade of liquidations, leading to rapid price movements.
Actionable Insights from BTC Analysis: What Should Traders Watch?
Given the current market dynamics, a robust BTC analysis reveals several key takeaways for traders and investors:
- Monitor the CME Gap: The $114.3K CME gap remains a primary target. A move to fill this gap is highly anticipated and could provide a buying opportunity if support holds.
- Key Breakout/Breakdown Levels: Watch for a clear break above $121K or a decisive breakdown below $113.6K. These levels will signal the next significant trend.
- Oscillating Pattern: Be prepared for continued range-bound trading. Scalping strategies within the defined clusters might be effective, but caution is advised due to potential volatility.
- Structural Liquidity: The market is currently driven more by these structural liquidity zones than by external news or catalysts. Understanding these technical levels is paramount.
Conclusion: A Tense Standoff for Bitcoin’s Future
Bitcoin’s current predicament—trapped between key liquidation clusters and under the shadow of an unfilled CME gap—highlights a period of intense indecision in the market. While the lack of a dominant trend can be frustrating, it also presents a fascinating case study in how structural liquidity can dictate price action. Traders and investors should remain cautious, focusing on the critical $113.6K–$114.5K support and $120K–$121K resistance zones. The resolution of the $114.3K CME gap will likely be the catalyst that determines Bitcoin’s next significant move, setting the stage for either a bullish rebound or a deeper correction. The coming weeks will be crucial for understanding which direction Bitcoin will ultimately choose.
Frequently Asked Questions (FAQs)
Q1: What does it mean for Bitcoin to be ‘trapped between clusters’?
When Bitcoin is ‘trapped between clusters,’ it means its price is consolidating within a defined range, unable to break significantly above a resistance level (upper cluster) or below a support level (lower cluster). These clusters represent areas with high concentrations of buy and sell orders, creating strong price barriers.
Q2: Why is the CME gap at $114.3K important for Bitcoin’s price?
The CME gap at $114.3K is significant because historical data shows that such gaps on the CME Bitcoin futures chart often get ‘filled,’ meaning the price tends to revisit that level. It acts as a magnet, influencing traders’ expectations and potentially pulling Bitcoin’s price towards it, especially if other factors align.
Q3: What are ‘liquidation clusters’ and how do they affect Bitcoin price?
Liquidation clusters are price zones where a large number of leveraged trading positions would be automatically closed (liquidated) if the price moves against them. These forced buy or sell orders create significant liquidity and can act as strong support or resistance levels, influencing price movements as the market approaches these areas.
Q4: What is the current Bitcoin forecast based on this analysis?
The current Bitcoin forecast suggests continued range-bound trading in the short term, with a high probability of price revisiting the lower cluster ($113.6K–$114.5K) to potentially fill the CME gap. A decisive break above $121K or below $113.6K would signal the next major directional move.
Q5: How can traders use this BTC analysis to make informed decisions?
Traders can use this BTC analysis by identifying key support ($113.6K–$114.5K) and resistance ($120K–$121K) levels for potential entry and exit points. Monitoring the CME gap’s influence and observing how price reacts to these liquidation clusters will be crucial for anticipating the next significant move and managing risk.


