Unlock the Secrets: Safely Reading Bitcoin Liquidation Maps

Navigating the unpredictable world of cryptocurrency trading can feel like sailing through a storm. Understanding tools that offer insight into market dynamics is crucial. One such tool gaining popularity is the Bitcoin liquidation map. This visual guide helps traders anticipate potential price movements driven by forced closures of leveraged positions.
What is Crypto Liquidation?
Before diving into the map, let’s clarify liquidation in crypto trading. Liquidation happens when an exchange automatically closes a trader’s leveraged position. This occurs because the trader’s margin falls below the required level to cover losses as the market moves against their bet.
- Long liquidations: Triggered when prices fall, impacting traders betting on a price increase.
- Short liquidations: Triggered when prices rise unexpectedly, affecting traders betting on a price decrease.
These events can happen rapidly, especially with high leverage, potentially wiping out significant capital in minutes. It’s a key risk in leveraged trading.
Understanding the Bitcoin Liquidation Map
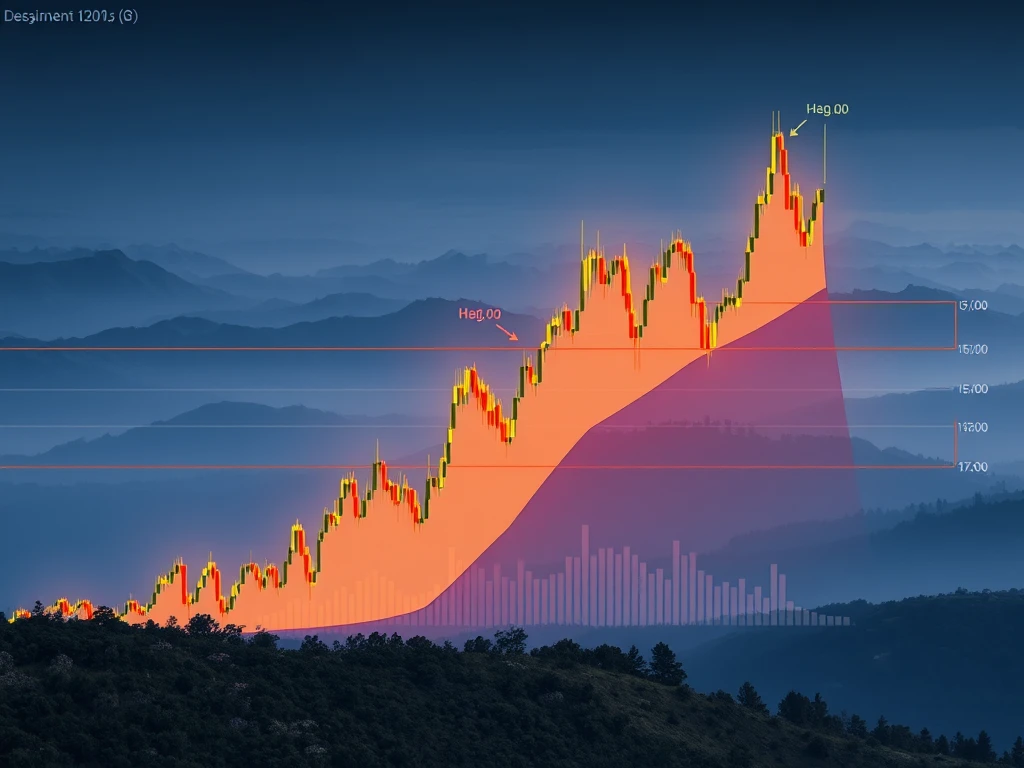
A Bitcoin liquidation map is essentially a heatmap showing price levels where significant amounts of leveraged positions are likely to be liquidated. These maps highlight ‘liquidation zones’ – price points where a cascade of forced selling (or buying) could occur if reached.
Tools like CoinGlass provide real-time maps, showing where large clusters of potential liquidations exist. These zones act like magnets, often attracting price action as whales and large traders may target these levels to trigger liquidations and profit from the resulting volatility.
Key components you’ll see on a map include:
- Heat zones: Areas colored or shaded to show concentration of potential liquidations. Denser color indicates higher potential impact.
- Liquidity pools: Clusters of stop-loss and liquidation orders.
- Open interest levels: Indicates where large leveraged positions are concentrated.
- Price imbalances/gaps: Areas lacking significant support or resistance, allowing swift price moves towards liquidation zones.
The map’s axes typically show price on one axis and the relative volume or strength of potential liquidations on the other. Taller bars or brighter colors usually signify more significant liquidation clusters.
Reading Liquidation Maps for Better Trading
Knowing how to interpret these maps is vital for developing a smart crypto trading strategy. Here’s how you can use them:
- Identify High-Risk Zones: See where dense liquidation clusters are. Avoid overleveraging near these areas. They can act as price targets.
- Time Entries and Exits: Liquidation clusters can help predict potential reversal points. Entering or exiting trades before price reaches a major cluster might help secure profits or avoid losses.
- Combine with Other Indicators: Use liquidation maps alongside technical analysis tools like support/resistance levels, RSI, or moving averages for a more complete market view.
- Observe Whale Activity: Large traders often use these maps to plan moves. Seeing price move towards a large liquidation cluster can signal potential whale action.
- Anticipate Reversals: Large liquidation events can sometimes mark local tops or bottoms, leading to price reversals.
- Set Stop-Loss Orders: The map can help determine logical places to set stop-loss orders, potentially just outside major liquidation zones to minimize risk.
Common Mistakes When Using Liquidation Maps
While powerful, misusing a Bitcoin liquidation map can be detrimental. Avoid these common errors:
- Trading Solely Towards Liquidity: Don’t assume price will always hit a liquidation zone. Markets are complex.
- Ignoring Scale or Color: Understand how your specific map tool represents intensity. Misreading this skews analysis.
- Over-Reliance: Liquidation data is one piece of the puzzle. It’s not a guarantee of future price action.
- Disregarding Macro Factors: News events, regulatory changes, or broader market sentiment can override technical signals from a map.
Always use liquidation maps as a supplementary tool within a comprehensive trading plan that includes risk management and other forms of analysis.
Conclusion: Navigating Volatility Safely
Understanding crypto liquidation and how to read a Bitcoin liquidation map provides a valuable edge in volatile markets. By identifying potential price magnets and risk zones, you can make more informed decisions about entry and exit points, manage leverage effectively, and potentially avoid costly liquidations. Remember, no tool is perfect, but integrating liquidation map analysis into your overall crypto trading strategy can significantly enhance your ability to navigate the market safely.


