Urgent Bitcoin Warning: 8 of 10 Bull Indicators Turn Bearish Despite $116K Surge
The cryptocurrency world often presents paradoxical situations. Recently, the Bitcoin price saw a marginal recovery, pushing above $116,000. However, this positive movement masks a deeper concern. Eight out of ten crucial crypto indicators have turned bearish, signaling a potential cooling in momentum for the ongoing Bitcoin bull market. This conflicting data creates a complex picture for investors. Understanding these signals is essential for navigating the volatile crypto landscape. We delve into the data to provide a comprehensive BTC analysis.
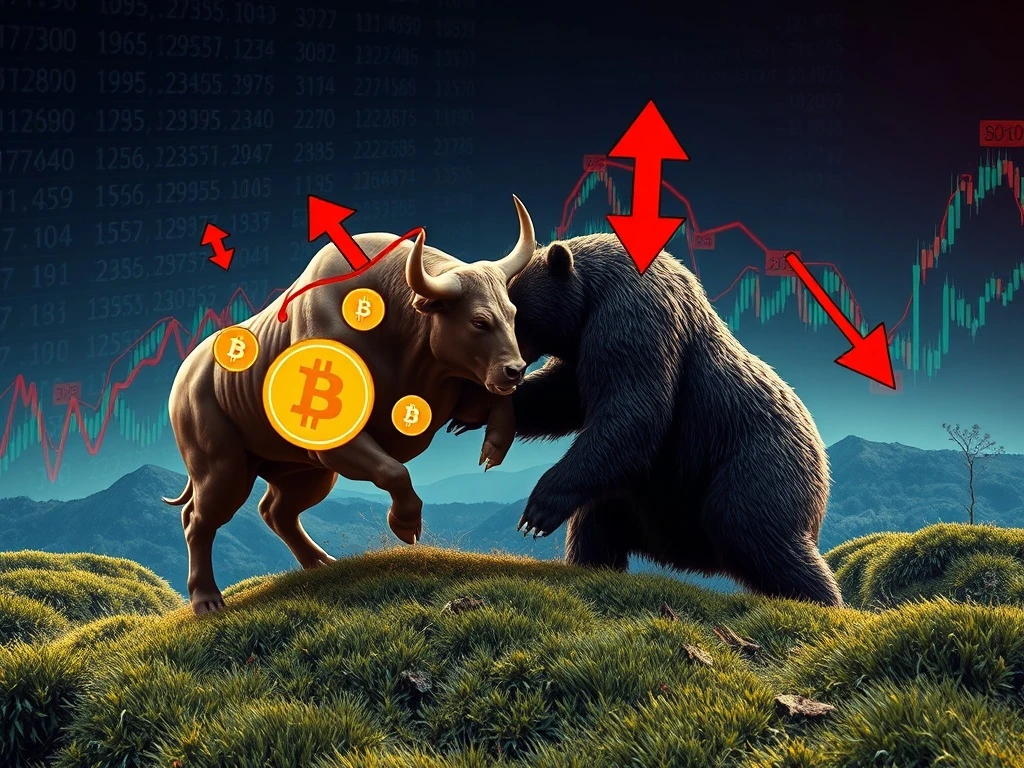
Unpacking Bearish Signals in the Bitcoin Bull Market
CryptoQuant, a leading blockchain analytics platform, highlights this significant shift. Their Bull Score Index, a comprehensive measure of market health, shows a predominantly bearish outlook. Momentum is clearly cooling, according to analyst JA Maartun. This shift occurs even as Bitcoin briefly reclaimed a key price level. Investors must therefore pay close attention to these underlying metrics.
The index comprises ten vital indicators. Currently, only two remain bullish: “Bitcoin demand growth” and “Technical signal.” Bitcoin demand growth tracks overall market interest. It has shown strength since July. The “technical signal” often aligns with common technical analysis metrics. However, the remaining eight indicators now flash red. This suggests a significant underlying weakness in the Bitcoin bull market structure.
The last time such a strong bearish signal appeared was in April. Bitcoin (BTC) then experienced a sharp decline to $75,000. Conversely, in July, eight indicators were green when BTC reached a peak of $122,800. This historical context underscores the importance of these signals for predicting future price movements.
Key Bearish Crypto Indicators Explained:
- MVRV-Z Score: This metric compares Bitcoin’s market value to its realized value. It helps identify periods of over or undervaluation. A bearish signal here suggests the asset is moving towards overvalued territory, prompting caution.
- Profit and Loss Index: This indicator shows how much of the Bitcoin supply is currently in profit. A high percentage can precede profit-taking. Bearish readings imply many holders are sitting on significant gains, increasing potential sell pressure.
- Bull Bear Cycle Indicator: This metric reflects the prevailing market sentiment. It often uses on-chain data from long-term holders. A bearish signal suggests a shift away from extreme bullishness, indicating caution.
- Inter Exchange Flow Pulse: This tracks Bitcoin moving to and from exchanges. Inflows typically suggest an intent to sell. Outflows indicate accumulation. A bearish pulse suggests increased inflows or reduced outflows.
- Network Activity Index: This measures the health and usage of the Bitcoin network. It includes active addresses and transaction counts. A declining index signals reduced adoption or interest.
- Stablecoin Liquidity: This indicates the amount of stablecoins available on exchanges. High liquidity means ‘dry powder’ for buying crypto. A bearish signal here implies low or decreasing stablecoin reserves, suggesting less immediate buying power.
- Trader Onchain Profit Margin: This measures the average profit margin of active traders on the blockchain. High margins often precede profit-taking events. Bearish implies traders have substantial unrealized gains.
- Trader Realized Price: This represents the average price at which traders acquired their coins. When the market price significantly exceeds this, it indicates large unrealized gains. A bearish signal suggests conditions ripe for profit-taking.
Remaining Bullish Signals and Current BTC Analysis
Despite the prevailing bearishness, two crypto indicators continue to show strength. These offer a glimmer of hope amidst the cautionary data. Understanding their resilience provides a more balanced perspective on the current market state. Investors often seek such counter-signals to form a complete BTC analysis.
First, “Bitcoin demand growth” remains robust. This indicator measures the overall demand for Bitcoin in the market. It has consistently shown bullish signs since July. This suggests a foundational interest in the asset persists. Strong demand can underpin future price recoveries, even during periods of volatility.
Second, the “Technical signal” also flashes bullish. This indicator likely tracks various technical analysis metrics. It includes price patterns, moving averages, and volume trends. A bullish technical signal indicates that some traditional chart analysis points towards continued upward potential. However, its strength is diminished by the majority of other indicators.
The CoinGlass Crypto Bitcoin Bull Run Index (CBBI) offers another perspective. This index analyzes nine different metrics. It aims to ascertain the current stage of the bull market. The CBBI currently registers 74. This indicates that the market is almost three-quarters into its bull cycle. Interestingly, only one of the 30 CoinGlass bull market peak indicators has flashed. This lone signal is the altcoin season index. This suggests that while altcoins may be peaking, Bitcoin’s ultimate top might still be some distance away. This divergence requires careful consideration in any comprehensive BTC analysis.
Shifting Market Sentiment and Lagging Bitcoin Performance
The broader financial landscape also influences market sentiment for Bitcoin. Recently, crypto prices largely treaded water. However, Bitcoin notably lagged behind its peer group. It also underperformed traditional assets like equities and spot gold. This divergence raises questions about Bitcoin’s immediate appeal. It reflects a cautious stance among institutional and retail investors.
Augustine Fan, head of insights at SignalPlus, observed this trend. She noted a slowdown in net buying momentum. Digital asset treasury buying has fallen off substantially. Centralized exchanges also report low levels of new capital on-ramping. This suggests investors prefer to stay within equity proxies. This behavior points to a preference for traditional, less volatile assets. Fan suggests the short-term picture looks challenging. She recommends a more defensive stance. This aligns with historical seasonal trends for risk assets in general. Therefore, a cautious approach to the Bitcoin bull market seems prudent.
The subdued inflows into crypto exchanges highlight a hesitant market sentiment. Investors are not rushing to deploy new capital. This contrasts with earlier periods of aggressive accumulation. While existing holders may remain optimistic, new money is entering slowly. This reduced influx of fresh capital can constrain upward price movement. It adds another layer of complexity to the current market dynamics. Furthermore, the altcoin season index flashing suggests capital might be rotating away from Bitcoin into smaller cap assets. This rotation could temporarily dampen Bitcoin’s performance.
The September Correction and Future Bitcoin Price Outlook
Many market observers anticipated a September correction. This is a common seasonal pattern for risk assets. The recent price action aligns with these expectations. Despite the bearish signals, some analysts remain optimistic about the long-term Bitcoin bull market. They predict an extended cycle. This perspective offers a contrasting view to the immediate concerns raised by the bearish crypto indicators.
Crypto podcaster Tony Edward noted a recovery in global liquidity. He believes it is attempting to hit a new high. Edward suggests this bull market cycle is extending. He anticipates a potential local top in Q4. He even projects a blowoff top in Q1 2026. This long-term outlook contrasts sharply with the short-term bearish indicators. It implies that current corrections are merely temporary setbacks within a larger upward trend. Investors often consider such long-term forecasts when evaluating their strategies. This provides a different angle for BTC analysis.
The Bitcoin price recently made a notable move. It topped $116,000 for the first time in three weeks. This followed a 1.5% daily gain. The asset is now only 6.8% away from its all-time high. This recovery shows resilience despite the bearish undercurrents. Furthermore, the current correction has been shallower than in previous cycles. This suggests underlying strength. It indicates that buyers are stepping in at higher levels than in past downturns. This resilience is a positive sign for the long-term health of the Bitcoin bull market. It indicates strong foundational support. This helps counter some of the negative sentiment from the indicators.
Navigating Conflicting Signals: What’s Next for the Bitcoin Bull Market?
The current state of Bitcoin presents a complex picture. On one hand, the Bitcoin price shows resilience, reclaiming key levels. It also demonstrates a shallower correction compared to historical patterns. On the other hand, a majority of crucial crypto indicators are flashing bearish. This suggests a cooling in momentum. This dichotomy requires careful navigation from investors. A thorough BTC analysis must consider both bullish and bearish factors.
The mixed signals highlight the importance of a balanced perspective. Short-term traders might find the bearish indicators concerning. Long-term investors, however, might view the current correction as a buying opportunity. This is especially true if they believe in an extended bull market cycle. The altcoin season, while a positive for other assets, can temporarily divert capital from Bitcoin. This impacts its immediate performance. Therefore, understanding capital flow is crucial for assessing overall market sentiment.
Ultimately, the cryptocurrency market remains highly dynamic. Investors should continue to monitor these key indicators closely. They should also stay informed about broader economic trends. While the current outlook presents challenges, Bitcoin’s history shows its ability to surprise. Caution remains advisable. Yet, the potential for future growth still exists. Continuous research and a well-defined strategy are paramount for success in this evolving market. This is particularly true when faced with such conflicting data points. The interplay between price action and on-chain metrics will dictate the next phase of the Bitcoin bull market.