Bitcoin Cash (BCHUSDT) Market Analysis: Key Trends and Trading Strategies
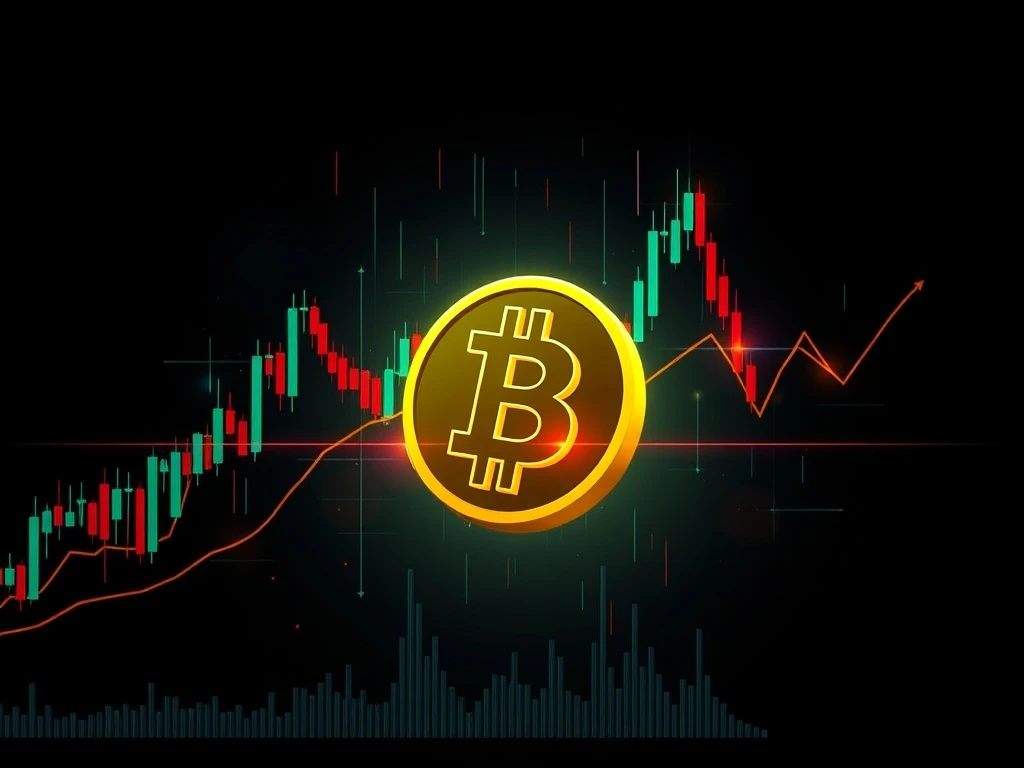
Bitcoin Cash (BCHUSDT) has shown significant volatility recently, presenting both opportunities and risks for traders. This analysis dives deep into the latest price movements, key technical indicators, and potential trading strategies to help you navigate the market.
Bitcoin Cash Price Trends: What’s Driving the Movement?
Over the past 24 hours, Bitcoin Cash fell from $578 to $558, reflecting bearish momentum. Key observations include:
- Key support at $562–$563 held temporarily, but RSI remains oversold.
- Volatility expanded as Bollinger Bands widened, indicating uncertain sentiment.
- A large bullish candle near $570–$571 suggests a potential short-term bounce.
Crypto Trading Strategies for BCHUSDT
Technical indicators provide critical insights for traders:
- Moving Averages: Price remains below the 20-period and 50-period MAs, reinforcing bearish bias.
- MACD & RSI: MACD crossed below the signal line, while RSI dipped into oversold territory, hinting at a possible bounce.
- Bollinger Bands: Widening bands signal increased volatility and potential mean reversion.
Market Analysis: Key Levels to Watch
Critical Fibonacci retracement levels:
| Level | Price | Significance |
|---|---|---|
| 38.2% | $575.6 | Key resistance for bullish reversal |
| 61.8% | $563.5 | Support level tested recently |
Conclusion: Navigating Bitcoin Cash Volatility
Bitcoin Cash faces near-term uncertainty, but key levels and indicators provide actionable insights. Traders should monitor volume and RSI for reversal signals while staying cautious of continued bearish momentum.
Frequently Asked Questions (FAQs)
- What caused the recent drop in Bitcoin Cash price?
Bearish momentum and diverging volume contributed to the decline, with key support levels being tested. - Is now a good time to buy Bitcoin Cash?
RSI suggests a potential bounce, but low volume raises concerns about sustainability. - What are the key resistance levels for BCHUSDT?
$575.6 (38.2% Fibonacci) is a critical resistance level to watch. - How does Bollinger Band expansion affect trading?
Widening bands indicate increased volatility, which can lead to sharp price movements.