Bitcoin Candlestick Charts: Simple Guide for Beginners to Unlock Smarter Trading
Are you new to the world of cryptocurrency and wondering how traders analyze price movements? You’re not alone. Understanding **Bitcoin candlestick charts** is a fundamental step for anyone looking to get into **Bitcoin trading for beginners**. These charts might look complex at first glance, but they are surprisingly simple to read and offer a powerful visual representation of market activity. This guide will break down everything you need to know to start reading **Bitcoin candlestick charts** with zero prior experience.
Why Read Bitcoin Charts? Understanding the Basics
Before diving into candlesticks, let’s touch on why analyzing charts matters. **Technical analysis crypto** involves studying past price data and volume to forecast future price movements. It’s a widely used approach in traditional finance and has become essential in crypto markets as Bitcoin prices fluctuate. Platforms like TradingView provide easy-to-use charting tools that display various types of price graphs, including the popular candlestick format.
What Are Candlestick Charts Explained?
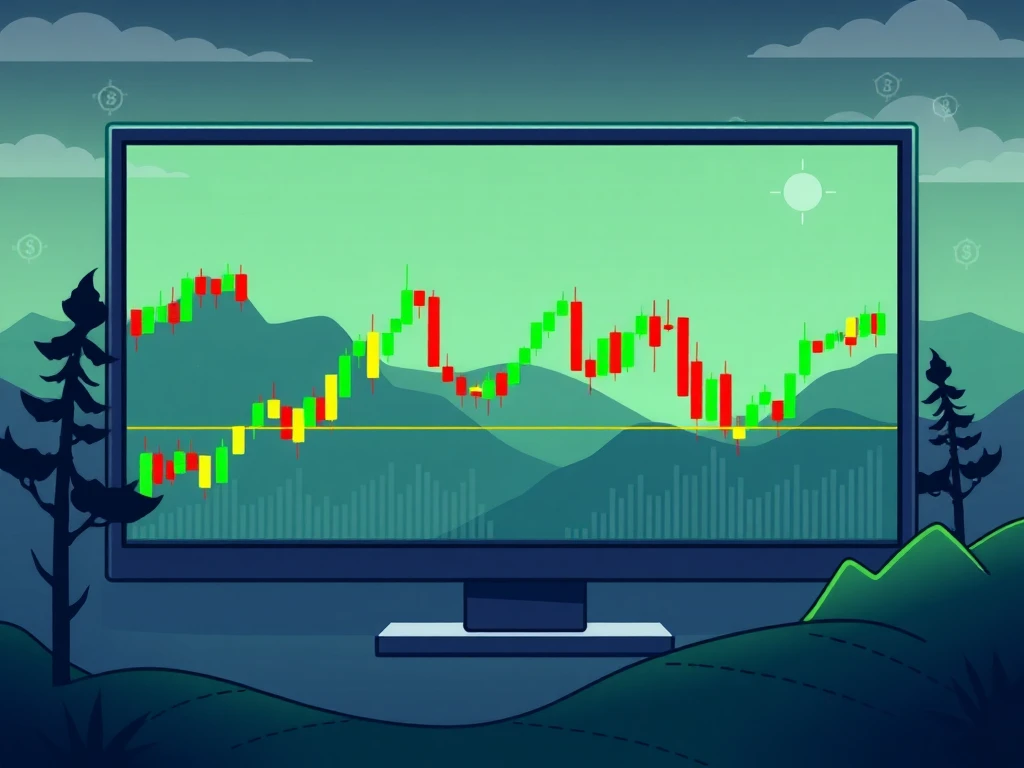
Candlestick charts originated in Japan centuries ago and were later adopted in Western markets. They offer a richer view of price action within a specific timeframe compared to simple line charts. Each candlestick represents the price movement over a chosen period (e.g., 1 minute, 4 hours, 1 day).
Key Components of a Candlestick:
- **Body:** The thick part of the candlestick. It represents the range between the opening and closing prices for the period.
- **Wicks (or Shadows):** The thin lines extending above and below the body. These show the highest and lowest prices reached during the period.
- **Color:** The color of the body indicates the direction of price movement.
Reading Candlestick Colors:
- **Green (or White):** Indicates a bullish period. The closing price was higher than the opening price.
- **Red (or Black):** Indicates a bearish period. The closing price was lower than the opening price.
How to Read Bitcoin Candlestick Charts: A Step-by-Step Approach
Learning to **read Bitcoin charts** using candlesticks involves understanding what each part signifies. For any given timeframe you select on your chart:
- The top of the upper wick is the highest price reached.
- The bottom of the lower wick is the lowest price reached.
- For a green candle, the bottom of the body is the opening price, and the top is the closing price.
- For a red candle, the top of the body is the opening price, and the bottom is the closing price.
The size of the body can indicate the strength of the price move. A long body suggests strong buying (green) or selling (red) pressure. A short body suggests less price movement and potential indecision in the market.
Example: Analyzing a 4-Hour Bitcoin Candlestick
Imagine you are looking at a 4-hour chart. A specific green candle shows:
| Component | Price | Meaning |
|---|---|---|
| Open Price | $90,000 | Price at the start of the 4-hour period. |
| Close Price | $93,500 | Price at the end of the 4-hour period (higher than open, hence green). |
| Highest Price (Upper Wick) | $95,000 | Peak price reached during the 4 hours. |
| Lowest Price (Lower Wick) | $88,700 | Lowest price reached during the 4 hours. |
This single candle tells you that within those four hours, Bitcoin started at $90,000, went as low as $88,700, as high as $95,000, and closed stronger at $93,500. The relatively long green body indicates significant buying activity during that period.
Advantages of Using Bitcoin Candlestick Charts
Candlesticks are popular for good reasons, especially when learning **Bitcoin trading for beginners**:
- **Visual Clarity:** They offer a quick, intuitive snapshot of price action, including the range and sentiment (bullish/bearish).
- **Flexibility:** You can view them across various timeframes to suit different trading strategies, from short-term scalping (e.g., 1-minute charts) to long-term investing (e.g., daily charts).
- **Pattern Recognition:** As you gain experience, you’ll start recognizing specific candlestick patterns that can signal potential reversals or continuations in price trends.
Moving Beyond Basics: Combining Candlesticks with Other Tools
While mastering **candlestick charts explained** is a great start, informed trading involves using multiple tools. Combining candlesticks with other indicators can provide stronger signals. Common tools used in **technical analysis crypto** include:
- **Moving Averages (MA/EMA):** Show the average price over time, helping identify overall trend direction.
- **Relative Strength Index (RSI):** Measures the speed and change of price movements to identify overbought or oversold conditions.
- **Fibonacci Retracement:** Helps identify potential support and resistance levels based on specific ratios.
- **Volume Profile:** Shows trading volume at different price levels, highlighting areas of high interest.
Learning to combine these tools with your understanding of **Bitcoin candlestick charts** will enhance your analytical skills.
Important Caution for Beginners
Reading charts is a valuable skill, but it’s crucial to remember that no tool guarantees future outcomes. Markets are influenced by many factors beyond technical patterns. Always combine your chart analysis with sound risk management practices. Never invest or trade more than you can afford to lose. This guide is for educational purposes and does not constitute investment advice.
Conclusion: Your First Step to Reading Bitcoin Charts
Learning to **read Bitcoin charts** using candlesticks is an accessible entry point into market analysis for beginners. You now understand the basic components, how to interpret them, and why they are a fundamental tool in **technical analysis crypto**. As you practice, you’ll become more adept at quickly assessing market sentiment and identifying potential opportunities. Remember to continue learning, explore other indicators, and prioritize risk management as you navigate the exciting world of Bitcoin trading.


