Crypto Fear & Greed Index Plummets to 20: Unpacking the Market’s Deepening Anxiety
Global cryptocurrency markets entered a pronounced state of anxiety this week as the widely monitored Crypto Fear & Greed Index plunged to a score of 20. This significant drop signals a deepening of the ‘extreme fear’ sentiment that has gripped digital asset investors. Compiled by the data analytics firm Alternative, this crucial barometer provides a quantifiable snapshot of market psychology, directly influencing trading behavior and capital flows across exchanges worldwide.
The Crypto Fear & Greed Index Plunges to Extreme Fear
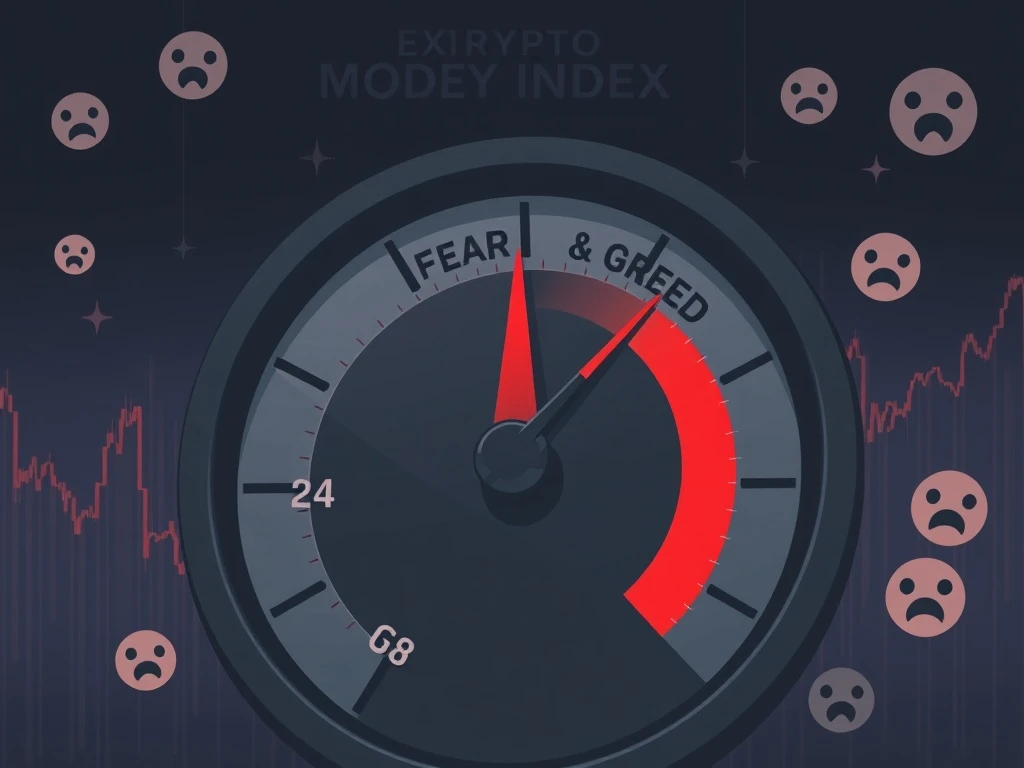
The Crypto Fear & Greed Index operates on a straightforward yet powerful scale from 0 to 100. Consequently, a reading of 0 represents maximum fear and panic, while 100 indicates unbridled greed and euphoria. The current score of 20 firmly places the market in the ‘Extreme Fear’ zone, a territory historically associated with heightened volatility and potential buying opportunities for contrarian investors. This four-point decline from the previous reading is not an isolated event but rather part of a broader trend of risk aversion affecting global financial markets.
Market analysts immediately noted the correlation between this drop and several concurrent factors. Firstly, regulatory announcements from major economies created uncertainty. Secondly, macroeconomic pressures, including interest rate decisions, continued to weigh on risk assets. Finally, technical analysis showed Bitcoin struggling to hold key support levels, exacerbating negative sentiment. This confluence of events triggered a measurable shift in the index’s underlying components.
Decoding the Index: A Multi-Factor Sentiment Analysis
Alternative’s index is not a simple survey; it is a sophisticated composite derived from six distinct data sources. Each component receives a specific weighting, creating a robust model of market emotion. Understanding this methodology is essential for interpreting the current score of 20.
- Volatility (25%): This component measures price swings, particularly for Bitcoin. Increased volatility, especially to the downside, strongly contributes to fear. Recent market action has shown elevated volatility metrics.
- Market Volume & Momentum (25%): Trading volume and momentum data are analyzed. Sustained selling volume on market dips, as observed recently, pushes the score lower.
- Social Media (15%): Sentiment analysis tools scan platforms like Twitter and Reddit for buzz and tone. A surge in negative or fearful commentary directly impacts this segment.
- Surveys (15%): Periodic polls of the investor community gauge direct sentiment. Recent survey data has reflected growing caution.
- Dominance (10%): Bitcoin’s share of the total crypto market cap is tracked. Rising dominance often occurs during fear periods as capital flees altcoins for the perceived safety of Bitcoin.
- Trends (10%): Search engine data for Bitcoin-related queries is analyzed. A spike in searches for “crash” or “bear market” would negatively affect the score.
The current low score indicates negative readings across most, if not all, of these metrics. This comprehensive approach helps filter out noise and identify genuine shifts in market psychology.
Historical Context and Market Cycles
Placing the current 20 reading in historical context provides critical perspective. The index has visited the ‘Extreme Fear’ zone numerous times throughout cryptocurrency’s volatile history. For instance, during the March 2020 COVID-19 market crash, the index hit a low of 8. Similarly, the bear market bottoms in late 2018 and early 2019 saw prolonged periods with scores below 20.
Conversely, at the peak of the 2021 bull market, the index frequently registered ‘Extreme Greed’ scores above 75, even touching 90. This historical volatility in sentiment underscores the cyclical nature of the asset class. Analysts often observe that sustained periods of extreme fear have, in the past, preceded significant market rallies, as weak hands capitulate and long-term value investors accumulate assets at lower prices. However, this is a historical observation, not a prediction of future performance.
The Ripple Effect: Impacts Across the Crypto Ecosystem
A prolonged period of extreme fear, as indicated by the index, has tangible effects across the entire blockchain ecosystem. Trading behavior typically changes dramatically. Retail investors may pause recurring purchases or sell holdings, while institutional players often become more selective, focusing on infrastructure and fundamental research over short-term trades.
Furthermore, project development and funding can feel the impact. Venture capital flows into the crypto sector may slow, and projects may face increased scrutiny. However, seasoned builders often use these periods to focus on development away from the hype of a bull market. The sentiment also affects related markets, such as NFTs and decentralized finance (DeFi), where activity and total value locked (TVL) often correlate with broader market sentiment.
Expert Analysis on Navigating Extreme Fear
Financial psychologists and veteran traders emphasize that indices like this one are best used as a tool for context, not a direct trading signal. “The Fear & Greed Index is excellent for measuring the temperature of the market room,” notes a behavioral finance analyst from a major university. “However, it’s crucial to remember that sentiment is a lagging indicator in some respects. Extreme fear can persist, and markets can always become more fearful.”
Risk management becomes paramount during such phases. Experts consistently advise investors to reassess their portfolio allocation, ensure they are not over-leveraged, and base decisions on fundamental research and personal financial goals rather than emotional reactions to price swings. The index serves as a reminder of the prevailing mood, helping investors avoid the common pitfall of assuming their personal sentiment reflects the entire market’s.
Conclusion
The Crypto Fear & Greed Index reading of 20 provides a clear, data-driven signal that extreme fear dominates current cryptocurrency market sentiment. This score results from a calculated analysis of volatility, volume, social media, surveys, dominance, and search trends. While historically, such depths of pessimism have marked cyclical lows, the index primarily offers a snapshot of present psychology, not a guarantee of future price action. For investors, it underscores the importance of discipline, rigorous research, and a long-term perspective, especially when market emotions run high. Monitoring this index, alongside fundamental and on-chain data, remains a valuable practice for navigating the complex and often emotional landscape of digital assets.
FAQs
Q1: What does a Crypto Fear & Greed Index score of 20 mean?
A score of 20 indicates the market is in a state of “Extreme Fear.” This is a quantitative measure based on data like volatility and social sentiment, suggesting widespread pessimism and risk aversion among investors.
Q2: Who creates the Crypto Fear & Greed Index and how is it calculated?
The index is compiled by the data provider Alternative. It uses a weighted formula incorporating six factors: volatility (25%), market volume/momentum (25%), social media (15%), surveys (15%), Bitcoin dominance (10%), and Google search trends (10%).
Q3: Is the Extreme Fear zone a good time to buy cryptocurrency?
Historically, periods of extreme fear have sometimes preceded market recoveries, as prices may be depressed. However, this is not financial advice. The index measures sentiment, not value, and markets can remain fearful. Any investment decision should be based on personal research and risk tolerance.
Q4: How often does the Crypto Fear & Greed Index update?
The index updates daily, providing a near real-time gauge of market sentiment. This allows investors and analysts to track shifts in psychology as news and price action develop.
Q5: Has the index been this low before, and what happened afterward?
Yes, the index has reached similar or lower levels during major market downturns, such as in March 2020 and the 2018-2019 bear market. Following those periods, markets eventually recovered, though the timing and trajectory varied significantly. Past performance does not predict future results.