XRP On-Chain Metrics Reveal Alarming 2022 Bear Market Pattern Repeating in 2025
Recent blockchain data analysis reveals a concerning development for XRP investors in early 2025, as on-chain metrics show patterns strikingly similar to those preceding the 2022 cryptocurrency bear market. According to comprehensive data from blockchain analytics firm Glassnode, cited by industry publication Coindesk, XRP’s current market structure mirrors conditions that historically preceded significant price declines. This analysis comes at a critical juncture for the digital asset, which has experienced notable volatility throughout the past three years following regulatory developments and broader market cycles.
XRP On-Chain Metrics Show Historical Parallels
Glassnode’s detailed examination of XRP blockchain data identifies several key indicators that currently align with patterns observed in early 2022. Specifically, the analysis reveals that investors who entered positions within the last month have accumulated XRP at lower average prices than those who invested six to twelve months ago. Consequently, this creates an asymmetric profit structure where recent buyers maintain profitable positions while longer-term holders face unrealized losses. Market analysts note this dynamic often creates psychological pressure within investor communities, potentially triggering different behavioral responses based on entry points.
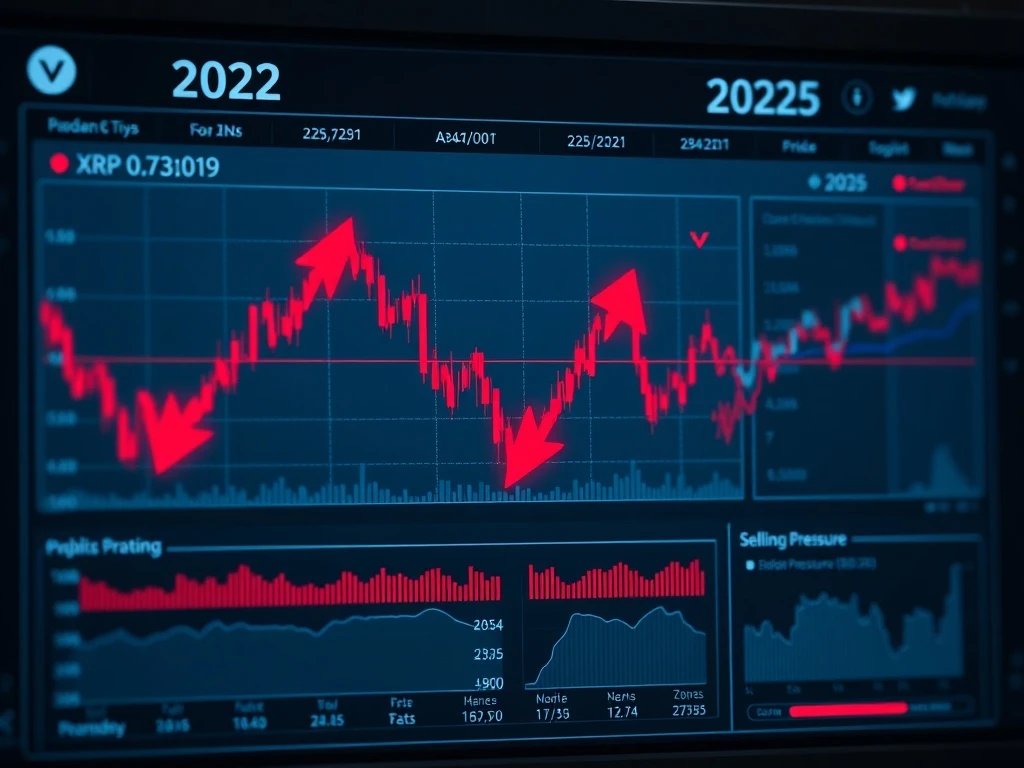
Furthermore, blockchain transaction patterns demonstrate that this profit-loss disparity has widened significantly throughout the first quarter of 2025. Historical data indicates similar conditions preceded the February 2022 price decline, when XRP traded at approximately $0.78 before descending to around $0.30 during subsequent months. While past performance never guarantees future results, market technicians emphasize that recurring patterns in investor behavior often manifest in predictable on-chain metrics.
Current Market Stagnation and Investor Sentiment
XRP currently faces significant resistance around the $2.00 price level, a psychological barrier that has repeatedly influenced investor decisions since mid-2024. Each retest of this critical threshold has resulted in substantial weekly losses ranging between $500 million and $1.2 billion in market capitalization. These consistent reactions suggest many investors choose to realize profits or minimize losses rather than increase their positions during price rallies. Market observers note this behavior reflects broader caution within the cryptocurrency sector as regulatory clarity evolves and macroeconomic conditions remain uncertain.
The following table illustrates key resistance levels and corresponding market reactions:
| Price Level | Period | Market Reaction | Estimated Capital Outflow |
|---|---|---|---|
| $2.00 | Q3 2024 | Strong rejection | $1.1 billion |
| $2.00 | Q4 2024 | Moderate rejection | $750 million |
| $2.00 | Q1 2025 | Current stagnation | Ongoing |
Additionally, exchange flow data indicates increased deposit activity coinciding with these price levels, typically signaling preparation for selling. This pattern aligns with the profit-taking behavior Glassnode identified among recent buyers who entered at lower price points.
Expert Analysis of Holder Dynamics
Blockchain analysts emphasize that the widening gap between holder cost bases creates inherent market instability. When recent buyers maintain profits while long-term investors face losses, the incentive structure diverges dramatically between these groups. Glassnode researchers explain that if price appreciation occurs slowly amid these conditions, long-term holders may increasingly capitulate to minimize further losses. This potential selling pressure could create downward momentum even without external negative catalysts.
Industry experts further note several critical factors distinguishing the current environment from 2022:
- Regulatory clarity has improved significantly since 2022, particularly regarding XRP’s legal status
- Institutional adoption has progressed with more traditional finance integration
- Market maturity has increased with more sophisticated investors and products
- Macroeconomic conditions differ substantially from the inflationary period of 2022
Despite these differences, on-chain behavior patterns show remarkable consistency, suggesting that certain investor psychology elements remain constant across market cycles.
Historical Context and Market Cycle Analysis
The cryptocurrency market has experienced multiple boom-bust cycles since Bitcoin’s creation in 2009, with each phase exhibiting identifiable patterns in on-chain metrics. The 2022 bear market followed an unprecedented period of monetary stimulus and retail investment frenzy during the COVID-19 pandemic. When central banks began tightening monetary policy in late 2021 and early 2022, risk assets including cryptocurrencies faced substantial repricing. XRP’s decline from $0.78 to $0.30 represented approximately a 62% decrease, aligning with broader market corrections during that period.
Current market conditions differ in several important aspects. Regulatory frameworks have advanced considerably, with multiple jurisdictions establishing clearer guidelines for digital asset classification and trading. The United States Securities and Exchange Commission’s case against Ripple has progressed through significant legal milestones, providing more certainty about XRP’s status. Additionally, traditional financial institutions have increased their cryptocurrency custody and trading services, potentially creating more stable market infrastructure.
However, technical analysts caution that improved fundamentals do not necessarily prevent price corrections when investor psychology shifts. The concentration of profitable recent buyers versus unprofitable long-term holders creates what market technicians call a “weak hands versus strong hands” dynamic. In such scenarios, even modest price declines can trigger disproportionate selling as different investor groups reach their pain thresholds.
Potential Market Scenarios and Risk Factors
Financial analysts outline several plausible scenarios based on the current on-chain metrics. First, if XRP maintains support above key levels and begins gradual appreciation, long-term holders might regain confidence and reduce selling pressure. Second, if prices decline moderately, recent profitable buyers might secure gains, creating temporary downward momentum. Third, a sharp decline similar to 2022 could occur if multiple negative catalysts converge, though most analysts consider this less probable given improved market structure.
Several risk factors could influence which scenario materializes:
- Broader cryptocurrency market trends often correlate across major assets
- Regulatory developments in major markets like the United States and European Union
- Ripple’s ongoing legal proceedings and their implications for XRP liquidity
- Macroeconomic indicators including interest rates and inflation data
- Technological developments in the XRP Ledger and competing networks
Market participants should monitor these factors alongside on-chain metrics for comprehensive risk assessment.
Conclusion
XRP on-chain metrics currently display patterns reminiscent of the 2022 bear market, particularly regarding asymmetric profit distribution between recent and long-term holders. While improved fundamentals and regulatory clarity distinguish the current environment, historical parallels in investor behavior warrant careful attention. The $2.00 price level continues to represent a significant psychological barrier, with repeated rejections suggesting substantial selling pressure. As Glassnode’s analysis indicates, the widening disparity between holder cost bases may inevitably increase selling pressure from long-term investors if price appreciation remains sluggish. Market participants should consider these XRP on-chain metrics alongside broader market conditions when making investment decisions, recognizing that while history doesn’t repeat exactly, it often rhymes in predictable patterns.
FAQs
Q1: What are the most concerning XRP on-chain metrics currently?
Glassnode’s analysis highlights the profit asymmetry between recent and long-term holders as particularly significant. Recent buyers profit while longer-term holders face losses, creating potential selling pressure if prices don’t rebound quickly.
Q2: How similar are current conditions to the 2022 bear market?
On-chain metrics show striking parallels, especially regarding holder profit distribution and reaction to key price levels. However, regulatory and macroeconomic environments differ substantially, making direct comparisons imperfect.
Q3: What is the significance of the $2.00 price level for XRP?
This level has represented strong psychological resistance since mid-2024. Each retest has triggered substantial selling, with weekly capital outflows between $500 million and $1.2 billion during previous attempts to sustain prices above this threshold.
Q4: Could XRP experience a decline similar to 2022?
While possible, most analysts consider a repeat of the 2022 decline less probable due to improved market structure, regulatory clarity, and institutional participation. However, similar on-chain patterns suggest some caution remains warranted.
Q5: How should investors interpret these on-chain metrics?
These metrics provide insight into investor behavior and potential market pressure points. They should complement rather than replace analysis of fundamentals, regulations, and broader market conditions when making investment decisions.