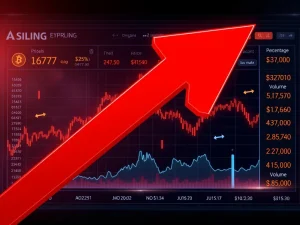
Bitcoin Price Plummets: Key Asset Falls Below Critical $92,000 Support Level

In a significant market movement on Thursday, April 10, 2025, the Bitcoin price has decisively broken below the $92,000 support level, triggering renewed analysis of cryptocurrency market stability. According to real-time data from Crypto News Insights market monitoring, BTC is currently trading at $91,978.88 on the Binance USDT perpetual futures market. This price action represents a notable shift from recent trading ranges and warrants a detailed examination of contributing factors, historical parallels, and potential implications for the broader digital asset ecosystem.
Bitcoin Price Breaches Key Psychological Level
The descent of the Bitcoin price below $92,000 marks a critical technical event that market analysts have been monitoring closely. This level had previously served as a consolidation zone following the asset’s ascent past the $90,000 milestone earlier this quarter. Consequently, the breach suggests a change in short-term trader sentiment and order flow dynamics. Market depth charts from major exchanges indicate thinning buy-side liquidity just above $91,500, which may have accelerated the downward move. Furthermore, this price action coincides with increased trading volume, typically a sign of conviction behind the move rather than mere market noise.
Historical data provides essential context for understanding current volatility. For instance, Bitcoin has experienced similar percentage drawdowns approximately fifteen times since 2020 during bull market phases. Each instance presented both risk and opportunity. The table below compares key metrics from recent notable corrections:
| Date | High Price | Low Price | Drawdown | Recovery Time |
|---|---|---|---|---|
| Q1 2023 | $24,900 | $19,500 | 21.7% | 42 days |
| Q3 2024 | $75,200 | $64,100 | 14.8% | 28 days |
| Current (2025) | $94,300 | $91,978* | ~2.5%* | Ongoing |
*Data as of reporting. This ongoing move may develop further.
Analyzing the Cryptocurrency Market Context
Several interconnected factors within the broader cryptocurrency market often influence Bitcoin’s price trajectory. Firstly, movements in traditional finance, particularly U.S. Treasury yields and the Dollar Index (DXY), have shown an inverse correlation with crypto assets in recent months. Secondly, the flow of funds into and out of U.S.-listed spot Bitcoin ETFs provides a transparent gauge of institutional demand. Reports from custodians indicate a slight slowdown in net inflows over the past three trading sessions, potentially removing a key support pillar.
Additionally, the derivatives market offers crucial signals. The aggregate funding rate for Bitcoin perpetual swaps turned slightly negative across major exchanges prior to the drop. This shift suggests that leveraged long positions were becoming expensive to hold, prompting some deleveraging. The estimated leverage ratio also dipped, indicating a reduction in risk appetite among traders. Meanwhile, the put/call ratio for Bitcoin options saw a modest increase, reflecting growing demand for downside protection.
Expert Perspectives on Market Structure
Market structure analysis from seasoned traders highlights key levels to watch. The area between $90,500 and $91,000 represents the next significant support cluster, based on volume-profile data from the past quarter. A sustained break below this zone could open the path toward the 50-day moving average, currently near $88,400. Conversely, a swift recovery above $92,500 would signal strong absorption of selling pressure and potentially invalidate the bearish breakout. On-chain analytics firms point to the behavior of long-term holders (LTHs). Their spending behavior remains subdued, which historically suggests a lack of panic and a view of the dip as a normal market cycle phase rather than a macro trend reversal.
Potential Impacts and Investor Considerations
The immediate impact of the Bitcoin price moving below $92,000 extends beyond a single ticker. Altcoins, which often exhibit higher beta to Bitcoin’s movements, have shown amplified volatility. Major cryptocurrencies like Ethereum (ETH) and Solana (SOL) experienced declines of 4-6% in the same period. This correlation underscores Bitcoin’s enduring role as the market’s benchmark and liquidity anchor. For investors, such periods emphasize the importance of risk management fundamentals.
- Portfolio Rebalancing: Sharp moves can alter asset allocation weights, prompting review.
- Liquidity Positioning: Ensuring access to capital to meet margin calls or seize opportunities.
- Tax-Loss Harvesting: For jurisdictions allowing it, strategic selling to offset gains.
- Dollar-Cost Averaging (DCA): Volatility can present entry points for systematic investment plans.
Market sentiment indices, which had been in “greed” territory for several weeks, have now cooled to “neutral.” This reset can be healthy for sustaining longer-term rallies by shaking out over-leveraged speculation. Regulatory developments also remain a backdrop. Clarity from global regulators on frameworks for stablecoins and institutional custody continues to be a slow-moving but critical driver for mainstream adoption.
Conclusion
The Bitcoin price falling below $92,000 serves as a timely reminder of the inherent volatility within digital asset markets. While the move is significant from a technical perspective, it occurs within the context of a larger, multi-year adoption trend. Market participants should focus on robust fundamentals, including network security, hash rate, and institutional adoption metrics, rather than short-term price fluctuations alone. The coming sessions will be crucial for determining whether this is a brief consolidation or the start of a deeper correction. As always, informed decision-making, grounded in data and a clear investment thesis, remains paramount for navigating the evolving cryptocurrency market landscape.
FAQs
Q1: Why did the Bitcoin price fall below $92,000?
The drop appears driven by a combination of technical factors, including a break of key support, a shift to negative funding rates encouraging deleveraging, and a slight slowdown in ETF inflows, all within a context of broader financial market adjustments.
Q2: How low could the Bitcoin price go following this break?
Based on current market structure, analysts are watching the next major support cluster between $90,500 and $91,000. A break below that could see a test of the 50-day moving average near $88,400, though this is not a prediction.
Q3: Does this price move signal the end of the bull market?
Not necessarily. Historical data shows that corrections of 10-20% are common within long-term bull trends. On-chain data does not yet show panic selling from long-term holders, which is often a marker of a major top.
Q4: What should an average investor do when Bitcoin’s price is volatile?
Investors should adhere to their pre-defined strategy, whether that involves dollar-cost averaging, rebalancing, or simply holding. Avoiding emotional decisions and ensuring one’s portfolio risk remains aligned with long-term goals is crucial.
Q5: How do other cryptocurrencies typically react when Bitcoin’s price falls?
Most major altcoins (like Ethereum, Solana) have a high correlation with Bitcoin and often experience magnified moves, both up and down. A falling Bitcoin price usually creates downward pressure across the entire cryptocurrency market.