XRP Price Plummets Below $2: Stark Contradiction Emerges Amid ETF Inflows and Surging Network Demand
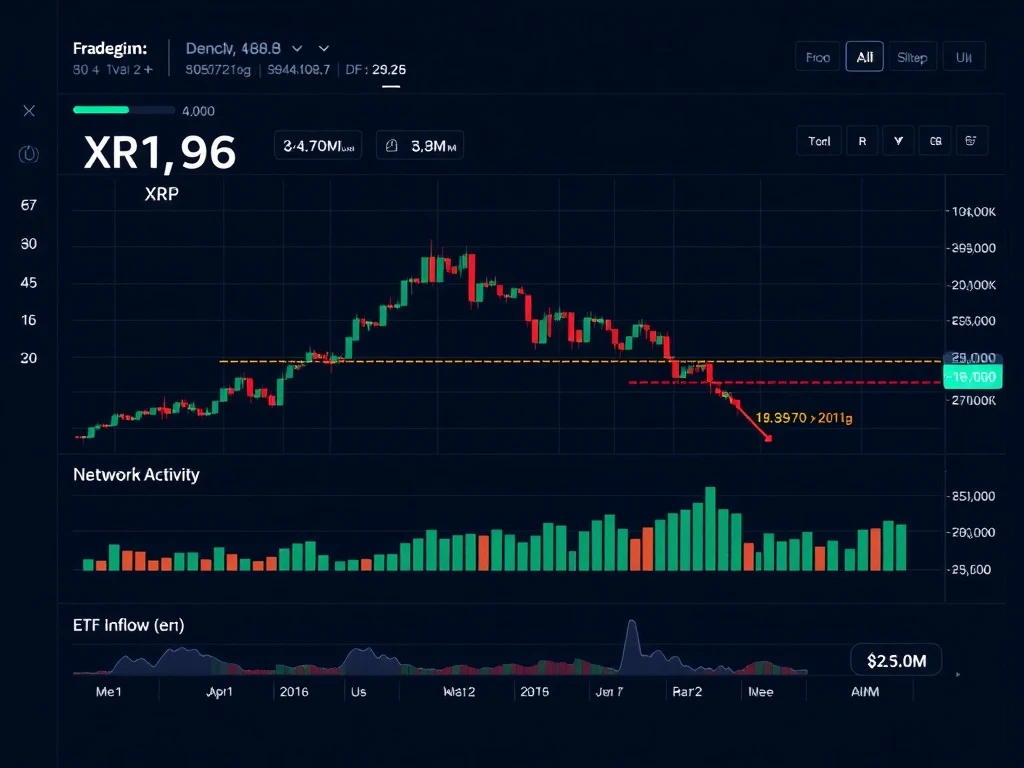
January 27, 2025 – In a stark market contradiction, XRP price has decisively broken below the critical $2 psychological support level, marking six consecutive days of decline. This significant drop occurs despite robust fundamental indicators, including persistent spot ETF inflows and a surge in XRP Ledger transactions to a six-month high. The divergence between strong on-chain and institutional metrics versus weak price action presents a complex puzzle for cryptocurrency analysts and investors worldwide.
XRP Price Breakdown Amid Broad Market Sell-Off
XRP extended its correction on Monday, dropping below the $2 threshold that had served as crucial support throughout early 2025. Consequently, the digital asset has now declined 18.5% from its eight-week high of $2.41 reached on January 6. This downward movement mirrors broader cryptocurrency market weakness, with Bitcoin falling to $92,000 and Ether testing support at $3,000. Market analysts attribute this widespread sell-off primarily to renewed trade war fears triggered by geopolitical developments over the weekend.
Specifically, US President Trump’s tariff threats against European countries regarding Greenland purchases sparked concerns about renewed international trade conflicts. These macroeconomic anxieties triggered substantial liquidations across cryptocurrency markets. More than $788.9 million in long positions were liquidated, with Bitcoin accounting for $224 million of that total. XRP experienced $39.5 million in long liquidations, representing the highest level since November 22, 2025. Across all cryptocurrencies, approximately $875 million was wiped from the market through combined short and long position liquidations, affecting around 250,000 traders.
Technical Indicators Signal Growing Bearish Momentum
Technical analysis reveals concerning signals for XRP’s near-term trajectory. The relative strength index (RSI) has reached its lowest level in 2026, indicating increasing downside momentum. Furthermore, demand for XRP derivatives has weakened substantially, with open interest falling to $3.56 billion on Monday from its yearly high of $4.55 billion on January 6. This 21.7% decline suggests diminishing trader confidence and could potentially accompany further price declines, mirroring patterns observed in October 2025.
| Metric | Current Value | Previous High | Change |
|---|---|---|---|
| Price | $1.96 | $2.41 (Jan 6) | -18.5% |
| Futures Open Interest | $3.56B | $4.55B (Jan 6) | -21.7% |
| Daily Transactions | 2.58M | 2.58M (July 2025) | 6-month high |
| ETF Cumulative Inflows | $1.28B | N/A | Steady growth |
Robust Fundamentals Fail to Support XRP Price
Despite the price decline, institutional sentiment toward XRP remains surprisingly positive. US-based XRP spot ETFs have continued to attract steady investor interest, recording inflows every day last week. According to data from SoSoValue, XRP ETFs added $1.12 million on Friday alone, bringing cumulative inflows to $1.28 billion and total assets under management to over $1.52 billion. The Franklin XRP ETF (XRPZ) was particularly notable as the only XRP ETF with inflows on Friday, bringing its net assets to $287.75 million.
Simultaneously, global XRP investment products attracted $69.5 million in inflows during the week ending January 16, signaling persistent institutional demand. This institutional interest contrasts sharply with retail investor sentiment, creating a notable divergence between different market participant groups. Additionally, on-chain metrics demonstrate robust network usage, with XRP Ledger transactions soaring to 2,575,561 on Wednesday – levels last observed in July 2025.
The ETF-Institutional Demand Paradox
The sustained ETF inflows present a compelling paradox for market observers. Typically, consistent institutional investment through regulated vehicles like ETFs provides substantial price support. However, XRP’s price action suggests that other factors are overwhelming this positive fundamental. Analysts speculate that several elements might explain this divergence:
- Market-wide risk aversion triggered by macroeconomic concerns
- Technical selling pressure as key support levels break
- Derivatives market liquidations creating cascading sell orders
- Profit-taking behavior following the January rally
- Regulatory uncertainty despite recent positive developments
Critical Support Levels and Technical Analysis
The XRP/USDT pair is currently testing a daily order block around $1.96, a level with historically strong support according to Glassnode data. The cost basis distribution heatmap reveals that more than 1.78 billion XRP were acquired around this price point over the past six months. This concentration of buying activity suggests that this level represents a significant battleground between bulls and bears.
The next substantial support zone sits between $1.78 and $1.80, where investors purchased approximately 1.84 billion XRP. Notably, the XRP/USD pair has not closed a daily candlestick below this level since April 2025, making its defense crucial for maintaining bullish structure. If this support fails, analysts identify subsequent levels at $1.61 (the local low) and approximately $1.41 (the 200-week exponential moving average), which would represent the final defensive line for XRP bulls.
Historical Context and Market Psychology
Market psychology around key psychological levels like $2 plays a significant role in cryptocurrency price action. These round numbers often attract substantial trading activity as they serve as mental benchmarks for investors. The breach below $2 likely triggered stop-loss orders and prompted additional selling from technically-oriented traders. Meanwhile, the surge in transactions on the XRP Ledger indicates robust underlying utility and network activity that typically correlates with long-term value appreciation, creating tension between short-term technical factors and long-term fundamental strength.
Broader Cryptocurrency Market Context
The XRP price decline occurs within a complex global financial landscape. Trade war fears have resurfaced as significant market movers, reminiscent of 2018-2019 volatility patterns. Cryptocurrency markets have demonstrated increasing correlation with traditional risk assets during periods of macroeconomic uncertainty, despite their original design as uncorrelated alternatives. This evolving relationship means that geopolitical developments now exert substantial influence on digital asset prices, sometimes overwhelming cryptocurrency-specific fundamentals.
Additionally, the cryptocurrency derivatives market has grown exponentially, creating new dynamics where liquidations can trigger cascading effects. The $875 million in combined liquidations across all cryptocurrencies demonstrates how leveraged positions can amplify market movements in both directions. This derivatives market maturation represents both increased sophistication and additional volatility sources for cryptocurrency trading.
Conclusion
XRP price finds itself at a critical juncture, having broken below the psychologically important $2 level despite strong fundamental indicators including persistent ETF inflows and surging network transactions. This divergence highlights the complex interplay between macroeconomic factors, technical analysis, derivatives market dynamics, and cryptocurrency-specific fundamentals. The immediate focus remains on whether XRP can hold key support levels around $1.80, with failure potentially leading to further declines toward $1.61 or lower. Meanwhile, the sustained institutional interest through ETF channels and robust on-chain activity suggest underlying strength that may eventually reassert itself once broader market conditions stabilize. Market participants will closely monitor whether this represents a temporary dislocation or a more fundamental shift in XRP’s market dynamics.
FAQs
Q1: Why did XRP price fall below $2 despite positive ETF inflows?
The decline resulted primarily from broader market sell-offs triggered by geopolitical trade war fears, which overwhelmed positive XRP-specific fundamentals including ETF demand and network activity.
Q2: What are the key support levels for XRP price?
Immediate support exists around $1.96, with stronger support between $1.78-$1.80. Critical levels below include $1.61 and the 200-week EMA around $1.41.
Q3: How significant are the XRP ETF inflows?
Very significant – cumulative inflows have reached $1.28 billion with total assets over $1.52 billion, indicating substantial institutional interest despite recent price weakness.
Q4: What does the surge in XRP Ledger transactions indicate?
The transaction count reaching a six-month high demonstrates robust network utility and adoption, which typically supports long-term value despite short-term price volatility.
Q5: Could XRP price recover quickly from this decline?
Recovery potential depends on broader market stabilization, defense of key support levels, and whether positive fundamentals eventually overcome current negative sentiment.