Bitcoin Price Analysis: Critical $90K Support Test Looms as US Traders Trigger Alarming Bearish Signal
Bitcoin faces mounting pressure in early 2025 as US-based traders demonstrate unprecedented bearish sentiment, potentially jeopardizing the cryptocurrency’s crucial $90,000 support level. Recent data reveals a significant shift in market dynamics, with American investors leading a sell-off that could trigger broader price declines. This development emerges amid evolving macroeconomic conditions and technical patterns that warrant careful examination by market participants.
Bitcoin Price Analysis: Understanding the US Selling Pressure
The Coinbase Premium Gap (CPG) serves as a critical indicator of relative buying and selling pressure between US and global cryptocurrency markets. This metric tracks the price difference between Bitcoin’s USD pair on Coinbase and its USDT pair on Binance. When the CPG turns negative, it signals that Bitcoin trades at a lower price on the US-based exchange, indicating stronger selling pressure from American investors compared to their international counterparts.
Recent data shows Bitcoin’s 30-day average CPG plummeting to approximately −63.85, marking the lowest reading since January 2025. Historically, such negative readings have preceded significant price declines. For instance, a similar pattern in early 2025 preceded Bitcoin’s drop from above $102,000 to roughly $78,350 within just four months. This historical correlation suggests current conditions may signal impending volatility.
Market analyst Mignolet notes the particular significance of this CPG low forming during a US market holiday when spot Bitcoin ETFs remained inactive. “This pattern indicates selling pressure originates from US whales operating outside traditional funds,” he explains. “It represents one of the traditional selling patterns we’ve observed repeatedly in cryptocurrency markets.”
Technical Analysis: The Rising Wedge Formation
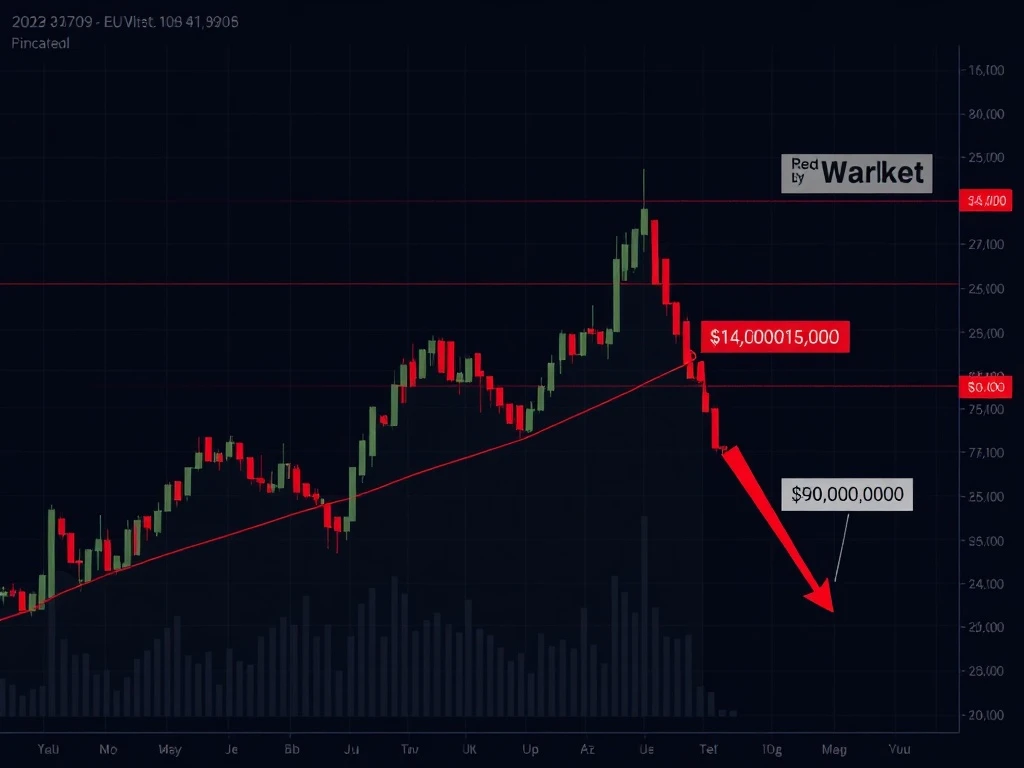
Bitcoin’s daily chart reveals a concerning technical pattern known as a rising wedge formation. This structure typically develops during corrective rebounds and often signals weakening upside momentum. The pattern features higher lows within narrowing trendlines, reflecting diminishing buying conviction despite apparent price recovery attempts.
The rising wedge formation increases downside risk substantially. A confirmed breakdown below wedge support could trigger accelerated selling toward prior demand zones. Based on the pattern’s height and historical reactions, the $80,000–$78,000 area emerges as the primary downside target. This represents approximately an 11-13% decline from current levels near $90,000.
Macroeconomic Context and Market Sentiment
Concurrent with Bitcoin’s technical deterioration, broader market sentiment has shifted noticeably. Traditional safe-haven assets including gold and silver have rallied significantly, signaling capital rotation away from risk assets. This movement coincides with increased geopolitical tensions and policy uncertainty.
US futures markets declined following President Donald Trump’s escalated tariff threats against European Union nations resisting his administration’s plans regarding Greenland. Such geopolitical developments typically increase market volatility and risk aversion, potentially exacerbating cryptocurrency selling pressure. The correlation between traditional market movements and cryptocurrency performance has strengthened throughout 2024 and into 2025.
Market Structure and Liquidity Considerations
The cryptocurrency market structure reveals several important dynamics. First, the separation between US and global trading patterns becomes increasingly significant as regulatory environments diverge. Second, the growing influence of institutional investors through spot Bitcoin ETFs creates new market dynamics that interact with traditional whale activity.
Third, liquidity conditions at various price levels will determine the severity of any potential decline. The $90,000 level represents a psychological and technical support zone where significant buying interest has previously emerged. Below this, the $85,000 and $80,000 levels contain substantial liquidity that could either provide support or accelerate declines if broken.
| Level | Type | Significance |
|---|---|---|
| $95,000 | Resistance | Previous consolidation zone |
| $90,000 | Support | Psychological and technical support |
| $85,000 | Support | Intermediate liquidity zone |
| $80,000 | Critical Support | Major demand zone and pattern target |
Historical Patterns and Market Psychology
Cryptocurrency markets frequently exhibit recurring patterns that informed traders monitor closely. The current combination of negative CPG readings and rising wedge formations has historical precedents worth examining. Previous instances have typically resolved with either:
- Sharp declines followed by rapid recovery when fundamentals remain strong
- Extended consolidation periods that rebuild market structure
- Unexpected reversals when external catalysts intervene
Market psychology plays a crucial role in these developments. The concentration of selling pressure from US investors suggests either profit-taking after recent gains or repositioning in response to macroeconomic concerns. Understanding trader motivations helps anticipate potential market movements.
Expert Perspectives on Current Conditions
Financial analysts emphasize several key considerations for Bitcoin’s near-term trajectory. First, the relationship between cryptocurrency and traditional markets continues evolving. Second, regulatory developments in major economies will influence institutional participation. Third, technological advancements and adoption metrics provide fundamental support regardless of short-term price movements.
Seasoned traders note that periods of negative sentiment often create buying opportunities for long-term investors. However, they caution against premature positioning before confirming trend changes. Risk management remains paramount in volatile market conditions.
Conclusion
Bitcoin faces a critical juncture as US trader sentiment turns decisively bearish, threatening the cryptocurrency’s $90,000 support level. The combination of negative Coinbase Premium Gap readings and a rising wedge formation suggests increased downside risk toward the $80,000–$78,000 range. While historical patterns provide context, current market conditions require careful monitoring of both technical developments and macroeconomic factors. Market participants should maintain disciplined risk management strategies while acknowledging that cryptocurrency markets have demonstrated remarkable resilience throughout previous cycles.
FAQs
Q1: What is the Coinbase Premium Gap and why does it matter?
The Coinbase Premium Gap measures price differences between Bitcoin trading on Coinbase (USD) and Binance (USDT). A negative gap indicates stronger US selling pressure, potentially signaling broader market sentiment shifts.
Q2: How reliable is the rising wedge pattern for predicting Bitcoin price movements?
While no pattern guarantees specific outcomes, rising wedges have historically indicated weakening momentum and increased downside risk. Their reliability improves when confirmed by other indicators like volume and market sentiment.
Q3: Why would US traders be selling Bitcoin more aggressively than global counterparts?
Potential reasons include profit-taking after recent gains, macroeconomic concerns specific to US investors, regulatory uncertainty, or portfolio rebalancing ahead of anticipated volatility.
Q4: What factors could prevent Bitcoin from dropping to $80,000?
Strong institutional buying, positive regulatory developments, unexpected macroeconomic shifts, or technical pattern invalidation through price movement above wedge resistance could all support prices.
Q5: How should traders approach current market conditions?
Traders should implement strict risk management, avoid emotional decision-making, monitor multiple timeframes, and consider both technical and fundamental factors before making trading decisions.