Crypto Fear & Greed Index Plunges to 44, Signaling Stark Shift to Fear Amid Market Uncertainty
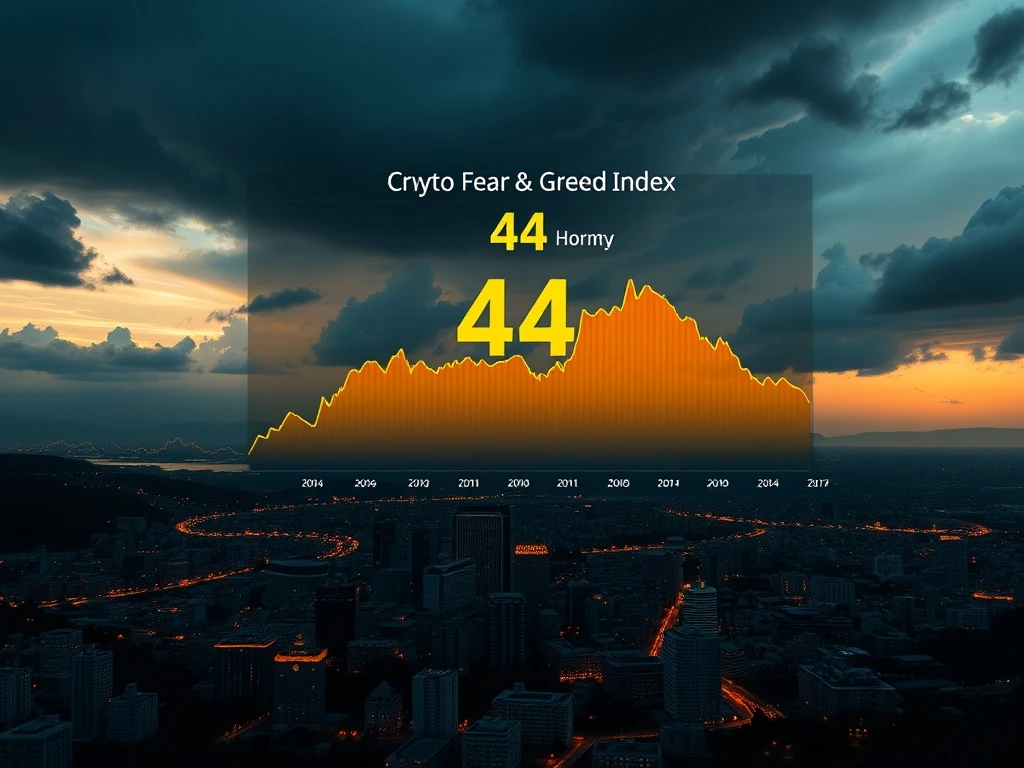
Global cryptocurrency markets witnessed a significant psychological shift this week as the widely monitored Crypto Fear & Greed Index dropped five points to 44, formally moving investor sentiment from neutral territory into the fear zone for the first time in recent months. This notable decline, reported by data provider Alternative.me, serves as a crucial barometer for the emotional state of the digital asset market, often preceding periods of heightened volatility and strategic repositioning by major institutional players. Consequently, analysts are now scrutinizing the underlying metrics—from Bitcoin’s dominance to social media chatter—to gauge the potential duration and impact of this newfound caution.
Crypto Fear & Greed Index Drops to 44: Decoding the Metrics
The Crypto Fear & Greed Index functions as a composite gauge, synthesizing multiple data streams into a single, digestible score. Its current reading of 44 results from a weighted calculation of six core components. Market volatility and trading volume each contribute 25% to the final score, providing a foundation in raw market mechanics. Social media sentiment and dedicated surveys each account for 15%, capturing the narrative and crowd psychology. Finally, Bitcoin’s market cap dominance and related Google search trends each make up 10%, indicating broader market structure and mainstream attention. This multi-faceted approach ensures the index reflects both on-chain activity and off-chain sentiment, offering a more holistic view than price alone.
Historically, readings between 0 and 25 signify “Extreme Fear,” often correlating with potential buying opportunities for contrarian investors. Scores from 26 to 46 indicate “Fear,” as seen currently. The “Neutral” zone spans 47 to 54, while 55 to 74 denotes “Greed.” Finally, 75 to 100 represents “Extreme Greed,” a zone typically associated with market tops and excessive speculation. The index’s drop from 49 to 44 is therefore significant, representing a crossover from a balanced, wait-and-see attitude to a more defensive, risk-averse posture among market participants. This shift frequently triggers changes in trading volume and derivative market positioning.
Analyzing the Drivers Behind the Shift to Fear
Several concurrent factors likely precipitated the index’s decline into fear territory. Firstly, Bitcoin and major altcoins experienced a week of sideways-to-negative price action, failing to break key resistance levels. This stagnation increased short-term price volatility, a primary input for the index. Secondly, on-chain data reveals a decrease in exchange inflows from long-term holders, suggesting a reduction in selling pressure but also a lack of new conviction buying. Meanwhile, social media analysis shows a measurable increase in negative or cautious commentary regarding regulatory developments and macroeconomic headwinds.
Furthermore, Bitcoin’s market dominance has seen slight fluctuations, impacting its 10% weighting in the index. Google Trends data for core cryptocurrency terms also shows a cooling from recent peaks, indicating a decline in retail investor curiosity. This combination of technical resistance, muted on-chain momentum, and a less fervent social narrative creates a feedback loop. As prices stall, sentiment sours; as sentiment sours, buying enthusiasm wanes, perpetuating the cycle. Market historians often note that sustained periods in the “Fear” zone (44) can build a foundation for healthier, less speculative advances once the sentiment pendulum swings back.
Historical Context and Expert Market Psychology
Comparing the current 44 reading to historical data provides essential context. For instance, during the bear market trough of late 2022, the index frequently dwelled in “Extreme Fear” (below 20). Conversely, during the bull market frenzy of late 2024, it hovered in “Greed” and occasionally touched “Extreme Greed.” The present “Fear” reading sits between these extremes, indicative of a market in a corrective or consolidation phase rather than a structural downturn. Veteran analysts emphasize that the index is a contrarian indicator at its extremes. Prolonged fear can signal capitulation, a necessary cleansing often required before a sustained rally.
Financial psychologists note that the shift from neutral to fear triggers different investor behaviors. Neutral markets encourage analysis and patience. Fearful markets, however, often prompt reactive decisions—like panic selling at lows or refusing to deploy capital at perceived bargains. Recognizing this emotional shift allows disciplined investors to adhere to strategy rather than emotion. The index, therefore, acts not as a timing tool, but as a mirror for the market’s mood, helping participants understand the prevailing psychological environment in which they are operating.
Potential Market Impacts and Trader Sentiment
The immediate impact of a fear-grade reading often manifests in derivative markets. Funding rates for perpetual swaps may turn less positive or slightly negative, reflecting reduced leverage demand from longs. Options markets might see increased demand for puts (downside protection), raising the volatility skew. Spot market volumes can contract as participants adopt a wait-and-see approach. However, this environment also creates opportunities. Accumulation addresses for Bitcoin and Ethereum sometimes show increased activity during fear phases, suggesting savvy entities are accumulating assets at lower sentiment-driven prices.
For portfolio managers, a fear reading triggers a review of risk parameters and asset allocation. It may justify increasing cash positions or adding selective hedges. For retail investors, it underscores the importance of dollar-cost averaging and avoiding emotional portfolio decisions. Crucially, a single day’s move to 44 does not dictate a trend. Observers will monitor whether the index stabilizes in the 40s, drops further into extreme fear, or quickly rebounds to neutral. The trajectory over the coming week will offer more insight than the single data point itself.
Conclusion
The Crypto Fear & Greed Index’s decline to 44 marks a clear transition in market psychology from neutrality to caution. This shift, driven by volatility, volume, and social sentiment metrics, provides a valuable real-time snapshot of collective investor emotion. While fear conditions can present short-term challenges and increased volatility, they also form an integral part of healthy market cycles, washing out excess speculation and creating potential long-term value. Monitoring the index’s components—especially Bitcoin dominance and search volume—will be key to understanding if this fear is a fleeting reaction or the precursor to a deeper market correction. Ultimately, the Crypto Fear & Greed Index remains an essential tool for navigating the complex emotional landscape of digital asset investing.
FAQs
Q1: What does a Crypto Fear & Greed Index score of 44 mean?
A score of 44 places the market in the “Fear” zone. This indicates that current data inputs—like volatility, social media sentiment, and trading volume—collectively reflect a cautious, risk-averse, and potentially pessimistic mood among cryptocurrency investors compared to more neutral or greedy periods.
Q2: How is the Crypto Fear & Greed Index calculated?
The index uses a weighted formula: volatility (25%), market volume/ momentum (25%), social media (15%), surveys (15%), Bitcoin dominance (10%), and Google Trends data (10%). Alternative.me aggregates and normalizes this data daily to produce a score from 0 (Extreme Fear) to 100 (Extreme Greed).
Q3: Is a ‘Fear’ reading like 44 bad for cryptocurrency prices?
Not necessarily. While it often coincides with negative or stagnant short-term price action, periods of fear can create sustainable buying opportunities. Historically, prolonged extreme fear has sometimes marked major market bottoms, making it a useful contrarian indicator for long-term investors.
Q4: How often does the Crypto Fear & Greed Index update?
The index updates daily, typically once per 24-hour period. It provides a snapshot of sentiment based on the most recent complete day of data across its various tracked metrics.
Q5: Should I change my investment strategy based on the Fear & Greed Index?
The index is best used as one tool among many for market awareness, not as a sole trading signal. It helps investors understand the prevailing emotional context. A disciplined strategy based on fundamentals and risk tolerance is generally more reliable than reacting to daily sentiment shifts.