Bitcoin Price Prediction: Technical Analysis Reveals Powerful Run-Up Targeting $113,000
Bitcoin traders are positioning for what analysts describe as a ‘strong run-up’ in early 2025, with classic chart patterns pointing toward a potential breakthrough to $113,000. The cryptocurrency has demonstrated remarkable resilience, trading approximately 9.5% above its January 1 opening price of $87,500. Market participants now watch critical technical levels that could determine Bitcoin’s trajectory toward six-figure valuations. This analysis examines the converging factors—from on-chain metrics to institutional demand—that create what experts call an ‘inflection point’ for the world’s leading digital asset.
Bitcoin Technical Analysis Points to Bullish Continuation
Technical analysts identify several compelling patterns supporting Bitcoin’s upward momentum. The BTC/USD pair currently consolidates around $95,000, facing immediate resistance between $96,000 and $99,500. This zone represents the convergence of the 100-day and 200-day exponential moving averages. Crucially, Bitcoin maintains position above its 21-day moving average at $91,200, which Michael van de Poppe of MN Capital identifies as the critical support level for maintaining the current uptrend. Meanwhile, the relative strength index (RSI) has climbed to 64 from oversold conditions in mid-November, indicating strengthening momentum without entering overbought territory.
Market structure reveals what analyst Matthew Hyland describes as ‘confirmed weekly hidden bullish divergence.’ This technical phenomenon occurs when price makes higher lows while momentum indicators show lower lows, typically signaling underlying strength before a significant upward move. Additionally, Bitcoin recently bounced from a multi-year trendline support that has held since March 2023. Historical data shows that previous bounces from this trendline resulted in substantial rallies, including the 172% surge from October 2023 to March 2024’s all-time high of $73,800.
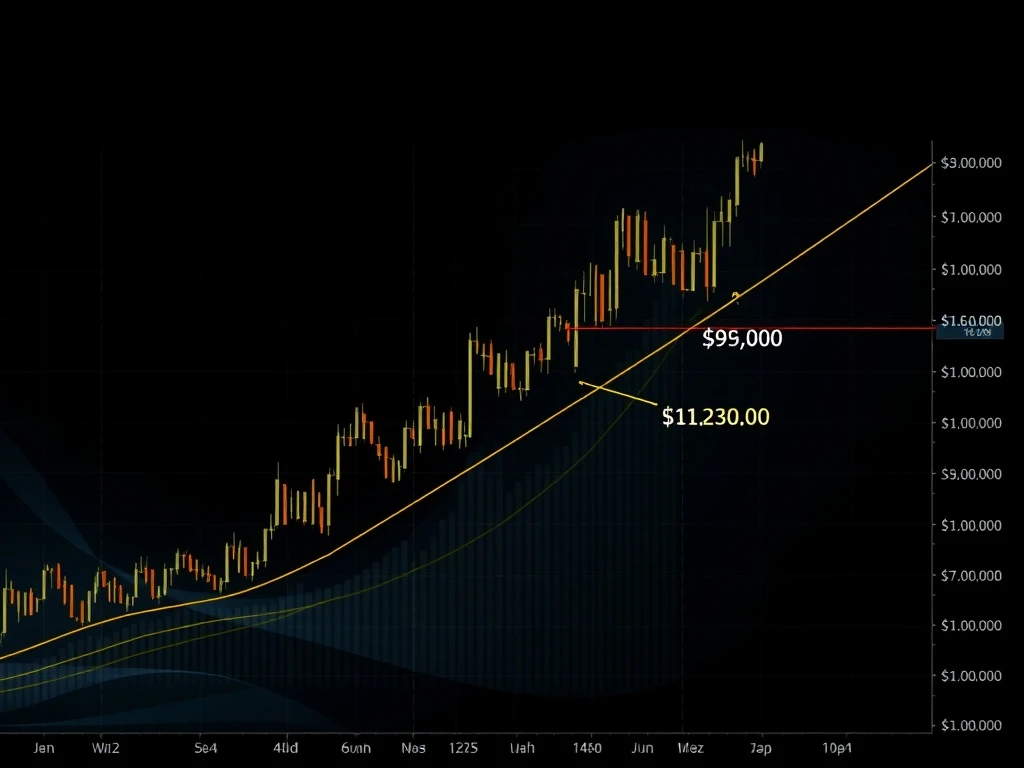
The Ascending Triangle Formation
The most prominent technical pattern currently capturing analyst attention is the ascending triangle formation visible on daily charts. This continuation pattern features a horizontal resistance line around $98,000 and a rising support line created by successively higher lows. The measured move target for this pattern projects to approximately $113,200. For this target to activate, Bitcoin must achieve a decisive daily close above the $98,000 resistance—a level that coincides with the short-term holder (STH) cost basis. Glassnode analyst Chris Beamish emphasizes that reclaiming this level would signal that recent buyers have returned to profitability, historically serving as a prerequisite for accelerated momentum.
Key Resistance Levels and Market Psychology
The $98,000 resistance represents more than just a technical barrier—it embodies significant market psychology. This price level corresponds to the average acquisition cost for short-term Bitcoin holders, creating what analysts describe as a ‘critical inflexion point.’ When prices approach this level, several dynamics emerge. First, short-term holders who purchased near this price may consider selling to break even, creating selling pressure. Second, a decisive break above this level typically triggers algorithmic buying and renewed institutional interest. Finally, surpassing this psychological barrier often generates media attention that attracts additional retail participation.
Market data reveals nuanced behavior around this critical level. Funding rates across major exchanges have stabilized despite Bitcoin’s approach to $97,000, suggesting that leveraged speculation remains relatively contained compared to previous bull market phases. This moderation in derivatives activity potentially creates healthier conditions for sustainable price appreciation. Furthermore, on-chain metrics indicate continued accumulation by large holders, with whale addresses increasing their Bitcoin holdings throughout the consolidation period.
| Price Level | Technical Significance | Market Impact |
|---|---|---|
| $91,200 | 21-day Moving Average | Primary trend support level |
| $96,000-$99,500 | EMA Convergence Zone | Major resistance cluster |
| $98,000 | STH Cost Basis | Psychological inflection point |
| $101,000 | Previous High | Trend confirmation level |
| $113,200 | Ascending Triangle Target | Measured move objective |
Institutional and On-Chain Fundamentals
Beyond technical patterns, fundamental factors support Bitcoin’s potential upward trajectory. Institutional demand continues to manifest through multiple channels. Spot Bitcoin exchange-traded funds (ETFs) maintain consistent inflows, with institutional custody solutions reporting growing allocations. Meanwhile, on-chain metrics reveal several bullish signals. The MVRV (Market Value to Realized Value) ratio, which compares market capitalization to realized capitalization, remains within historical ranges that have preceded previous bull market advances. Additionally, the percentage of Bitcoin supply that hasn’t moved in over a year continues to climb, indicating strong holder conviction despite price volatility.
Network fundamentals also demonstrate resilience. Bitcoin’s hash rate—the total computational power securing the network—remains near all-time highs, reflecting robust miner commitment and network security. Transaction fees have normalized following periods of congestion, creating more predictable conditions for both users and institutional participants. These fundamental strengths provide underlying support for technical price predictions, creating what analysts describe as a ‘confluence of bullish factors.’
Historical Context and Pattern Recognition
Historical analysis provides valuable context for current market conditions. Bitcoin has demonstrated a tendency for significant price movements following extended consolidation periods within recognizable chart patterns. The ascending triangle formation currently observed has appeared multiple times throughout Bitcoin’s history, typically preceding substantial upward moves. For instance, similar patterns developed before the 2017 bull market peak and again before the 2021 all-time high. While past performance never guarantees future results, pattern recognition remains a cornerstone of technical analysis methodology.
Analyst Mags emphasizes the significance of Bitcoin’s recent bounce from the long-term trendline support established in March 2023. Each previous interaction with this trendline has resulted in what Mags describes as a ‘strong run-up.’ The most recent example occurred in October 2023, when Bitcoin rallied 172% over the following five months. This historical precedent informs current analyst expectations, though market participants universally emphasize that cryptocurrency markets remain inherently volatile and unpredictable.
Several additional factors distinguish the current market environment from previous cycles. Regulatory clarity has improved in multiple jurisdictions, with clearer frameworks for institutional participation. Market structure has matured through the introduction of regulated derivatives and custody solutions. Furthermore, macroeconomic conditions—including monetary policy expectations and geopolitical developments—create a distinct backdrop for cryptocurrency valuation. These evolving conditions require analysts to balance historical pattern recognition with contemporary market dynamics.
Risk Considerations and Market Realities
While technical analysis suggests bullish potential, experienced traders emphasize several risk factors. First, the cryptocurrency market remains susceptible to sudden volatility from external events, regulatory announcements, or macroeconomic developments. Second, technical patterns can fail or evolve into different formations, requiring continuous monitoring and adjustment of trading strategies. Third, liquidity conditions can change rapidly, particularly during periods of market stress or unexpected news events.
Market participants also note that bullish technical setups sometimes precede consolidation rather than immediate breakout. The current ascending triangle pattern could potentially resolve through extended sideways movement before any decisive directional move. Additionally, the broader cryptocurrency market often experiences correlation during significant Bitcoin movements, meaning that altcoin performance could influence overall market sentiment and capital flows. These considerations underscore the importance of comprehensive risk management alongside technical analysis.
Conclusion
Bitcoin stands at what analysts describe as a critical technical juncture, with classic chart patterns pointing toward potential appreciation to approximately $113,000. The convergence of an ascending triangle formation, bullish divergence signals, and supportive on-chain metrics creates what technical analysts consider a compelling setup. However, realization of this Bitcoin price prediction requires overcoming significant resistance around $98,000—the short-term holder cost basis that represents both a technical and psychological barrier. Market participants will monitor daily closes above this level as potential confirmation of renewed upward momentum. While technical analysis provides valuable framework for understanding market structure, cryptocurrency investors must balance these insights with fundamental research and appropriate risk management strategies in this dynamic and evolving asset class.
FAQs
Q1: What is the ascending triangle pattern targeting for Bitcoin?
The ascending triangle pattern visible on Bitcoin’s daily chart has a measured move target of approximately $113,200. This technical formation develops when price encounters resistance at a horizontal level while creating successively higher lows, typically indicating accumulation before a potential breakout.
Q2: Why is the $98,000 level so important for Bitcoin?
The $98,000 level represents the short-term holder (STH) cost basis—the average price at which recent buyers acquired Bitcoin. Reclaiming this level would return recent purchasers to profitability, which historically precedes accelerated upward momentum according to Glassnode analysis.
Q3: What technical indicators support Bitcoin’s bullish case?
Multiple technical indicators support potential upward movement, including: Bitcoin trading above its 21-day moving average ($91,200), weekly hidden bullish divergence, RSI climbing from oversold to 64 without reaching overbought, and a bounce from multi-year trendline support that has preceded previous rallies.
Q4: How does current market structure differ from previous Bitcoin bull markets?
Current market structure features more institutional participation through ETFs and regulated custody, moderated derivatives activity with stable funding rates, improved regulatory clarity in multiple jurisdictions, and different macroeconomic conditions including monetary policy expectations and geopolitical factors.
Q5: What are the main risks to this Bitcoin price prediction?
Primary risks include: potential pattern failure or evolution, sudden volatility from external events or regulatory developments, changing liquidity conditions, extended consolidation instead of immediate breakout, and broader cryptocurrency market correlation that could influence sentiment and capital flows.