Bitcoin Price Faces Critical $94K Support Test as Geopolitical Easing Triggers Market Correction
Bitcoin’s bullish momentum encountered significant resistance during Thursday’s Wall Street trading session, with the cryptocurrency dipping below $96,000 as easing Middle East tensions prompted a market-wide reassessment of risk assets. The sudden correction, occurring on January 15, 2026, has traders closely monitoring the $94,000 support level that could determine Bitcoin’s near-term trajectory. Market analysts now emphasize that maintaining this crucial threshold represents the next major challenge for Bitcoin bulls seeking to reclaim the psychologically important $100,000 territory.
Bitcoin Price Correction Amid Geopolitical Developments
Bitcoin experienced a notable sell-off at the opening of Thursday’s U.S. trading session, shedding over 1% against the daily open to reach lows of $95,563 on the Bitstamp exchange. This movement diverged from traditional markets where stocks and precious metals gained ground following reports of de-escalating tensions between the United States and Iran. The correction highlights Bitcoin’s evolving relationship with geopolitical events and traditional risk indicators.
President Trump’s communication to Iran regarding his administration’s preference for diplomatic solutions over military escalation directly influenced market dynamics. Consequently, oil prices dropped sharply while Bitcoin followed this risk-off movement despite its typical characterization as a digital safe haven. This divergence from stock market performance underscores Bitcoin’s complex position within global financial ecosystems during periods of geopolitical uncertainty.
Technical Analysis and Critical Support Levels
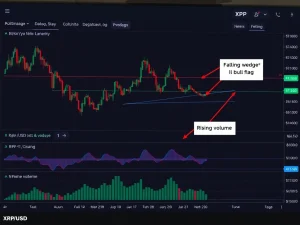
Market participants have identified several crucial technical levels that will determine Bitcoin’s price direction in coming sessions. Prominent trader Daan Crypto Trades emphasized the importance of the $94,000 region, stating that any breakdown below this level would create concerning technical patterns. The analysis references multiple converging trendlines that bulls must reclaim to maintain upward momentum toward the $100,000 psychological barrier.
The 200-day exponential moving average (EMA) currently sits at $99,555, representing another significant technical hurdle. This level previously rejected price advances in November 2025, preceding a substantial market decline. Additionally, the bull market support band around $101,000 and the 50-week EMA continue to influence trader sentiment and market structure analysis.
On-Chain Data Reveals Profit-Taking Behavior
CryptoQuant analytics platform data indicates that newer Bitcoin investors actively took profits as prices approached two-month highs. Short-term holders—entities holding Bitcoin for up to six months—transferred approximately 40,000 BTC to exchanges within a 24-hour period. Remarkably, about 37,800 BTC of this total moved at a profit compared to its last on-chain transaction.
- Short-term holder behavior: These investors remain sensitive to recent corrections
- Confidence rebuilding: Further upside movement needed to encourage holding
- Cost basis significance: Aggregate STH cost basis at $99,600 creates resistance
CryptoQuant contributor Darkfost noted that short-term holders require stronger confirmation of market strength before rebuilding confidence. The data suggests that unrealized profits must accumulate sufficiently to discourage premature selling during price advances.
Market Structure and Historical Context
Bitcoin’s current price action occurs within the context of its 2025 yearly open at $93,500, establishing this level as a potential target for weekly closes. The convergence of multiple technical indicators creates a complex landscape for traders navigating between short-term volatility and longer-term trend persistence. Historical patterns from November 2025 provide important context for understanding potential support and resistance behaviors.
| Level | Significance | Current Status |
|---|---|---|
| $94,000 | Critical support for bulls | Under test |
| $99,555 | 200-day EMA resistance | Key hurdle |
| $101,000 | Bull market support band | Major resistance |
| $93,500 | 2025 yearly open | Weekly close target |
Broader Market Implications and Correlations
The simultaneous movement of Bitcoin and oil prices away from equities and precious metals represents a noteworthy development in cross-asset correlations. This divergence challenges traditional assumptions about Bitcoin’s behavior during geopolitical events and suggests evolving market perceptions of cryptocurrency risk profiles. The relationship between digital and traditional assets continues to develop as institutional participation increases and regulatory frameworks mature.
Market analysts monitor these correlation shifts for insights into Bitcoin’s maturation as an asset class. The current decoupling from traditional safe havens like gold indicates that cryptocurrency markets may be developing independent drivers while remaining sensitive to macro-economic developments and geopolitical risk assessments.
Trader Psychology and Market Sentiment
Profit-taking behavior among short-term holders reflects ongoing uncertainty about Bitcoin’s ability to sustain upward momentum. The rapid movement of coins to exchanges at modest profit levels suggests that many market participants maintain cautious outlooks despite recent price advances. This psychology creates headwinds for sustained bullish movements until stronger conviction develops across market participants.
Longer-term holders, typically defined as those holding Bitcoin for more than six months, demonstrate different behavioral patterns. These investors generally show greater resistance to selling during corrections, providing underlying market stability. The interaction between short-term and long-term holder behaviors creates complex market dynamics that technical analysts must navigate when assessing support and resistance levels.
Conclusion
Bitcoin faces a critical technical test at the $94,000 support level following a geopolitical-driven correction. The cryptocurrency’s price action reflects complex interactions between technical indicators, on-chain data patterns, and broader market correlations. Traders must now watch whether Bitcoin can maintain this crucial threshold while navigating resistance at the 200-day EMA and bull market support band. Market structure analysis suggests that sustained movement above $100,000 requires rebuilding confidence among short-term holders who have demonstrated profit-taking tendencies at recent highs. The Bitcoin price trajectory will likely depend on both technical factors and evolving market perceptions of cryptocurrency’s role within global financial systems during periods of geopolitical uncertainty.
FAQs
Q1: Why is the $94,000 level so important for Bitcoin?
The $94,000 level represents critical technical support where multiple trendlines converge. A breakdown below this level would create concerning chart patterns and potentially signal deeper correction toward the 2025 yearly open at $93,500.
Q2: How did geopolitical developments affect Bitcoin prices?
Reports of easing tensions between the US and Iran prompted a risk-off movement that saw Bitcoin decline alongside oil prices while stocks and precious metals advanced. This divergence highlights Bitcoin’s evolving correlation patterns with traditional assets.
Q3: What does on-chain data reveal about current market sentiment?
CryptoQuant data shows short-term holders taking profits as prices approached two-month highs, transferring approximately 40,000 BTC to exchanges. This suggests that many investors remain cautious and require stronger confirmation of bullish momentum.
Q4: What are the key resistance levels above current prices?
Major resistance exists at the 200-day exponential moving average ($99,555), the bull market support band ($101,000), and the aggregate cost basis for short-term holders ($99,600). These levels represent significant technical hurdles.
Q5: How does this correction fit within Bitcoin’s longer-term trend?
The current movement represents a potential correction within a broader uptrend, testing key support levels that could determine near-term direction. Historical patterns from November 2025 provide context for understanding potential support and resistance behaviors.