Bitcoin Price Reveals Crucial Bottom Signal as BTC Nears Historic $101K Bear Market Reclaim
Global cryptocurrency markets witnessed a significant technical development this week as Bitcoin price action printed what analysts describe as a crucial bottom signal. The leading cryptocurrency, trading near two-month highs around $98,000, now eyes a historically significant resistance level at $101,000 that could determine the market’s trajectory for the coming months. This potential reclaim of the 50-week simple moving average represents an unprecedented event in Bitcoin’s bear market history, according to technical analysts monitoring the evolving situation.
Bitcoin Price Technical Indicators Flash Bullish Signals
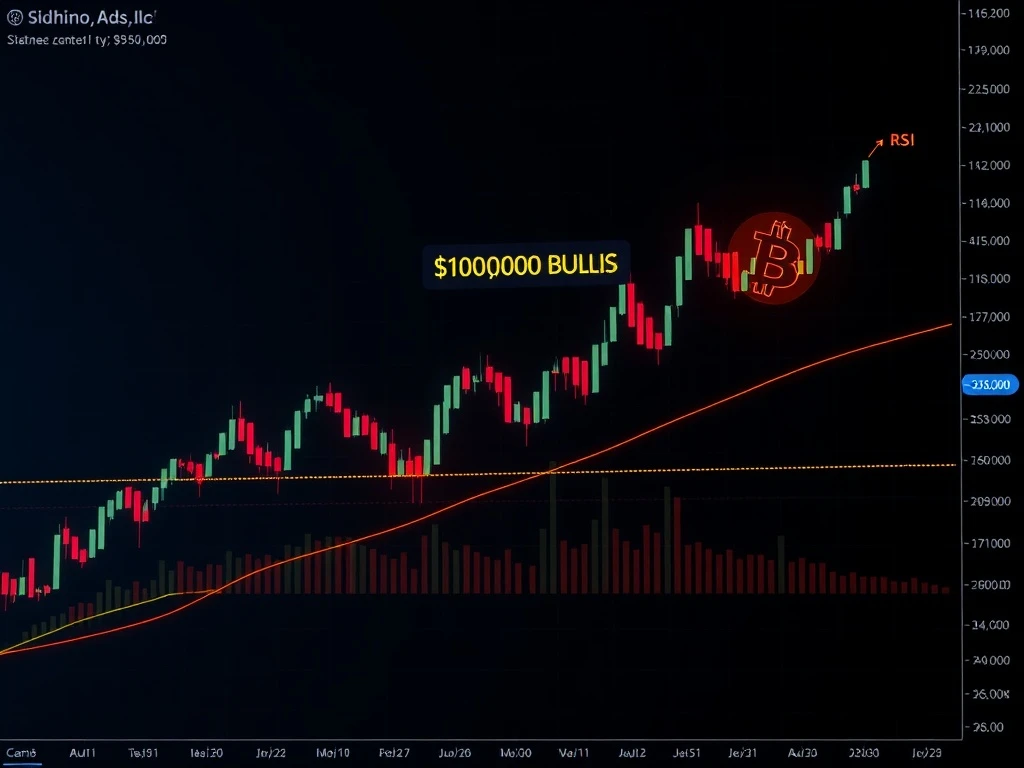
Technical analysis reveals multiple bullish confirmations across different timeframes. Bitcoin’s relative strength index (RSI) has climbed above the critical 50 midpoint for the first time since early October, signaling renewed upward momentum. Meanwhile, the moving average convergence/divergence (MACD) indicator has generated a buy signal on three-day charts. These combined technical developments create what traders describe as a classic reversal pattern.
Market analysts specifically point to a hidden bullish divergence on hourly charts, where the RSI indicator makes a lower low while the price forms a higher low. This pattern previously emerged last week when BTC/USD tested $90,000 support levels. The current technical setup suggests potential continuation of the recent upward movement, though traders remain cautious about resistance levels ahead.
Understanding the RSI and MACD Convergence
The simultaneous bullish signals from both RSI and MACD indicators carry particular significance for technical analysts. The RSI measures the magnitude of recent price changes to evaluate overbought or oversold conditions, while MACD tracks the relationship between two moving averages to identify momentum shifts. When both indicators align in bullish formation across multiple timeframes, historical data suggests increased probability of sustained upward movement.
Trader Jelle noted in social media analysis that “when Bitcoin forms both a 3-day bullish MACD cross and bullish divergence at the same time, it’s time to pay attention.” This combination has previously marked significant market bottoms according to historical chart patterns. The current alignment represents the first such convergence since market conditions shifted in October.
The $101,000 Resistance: A Historic Bear Market Threshold
Beyond immediate technical indicators, market observers focus intently on the $101,000 price level. This figure represents where Bitcoin’s 50-week simple moving average currently resides. According to historical analysis, Bitcoin has never reclaimed its 50-week SMA during what technical analysts classify as a bear market year. This creates a potentially pivotal moment for market structure.
Investor and commentator Isiah highlighted this unique circumstance, stating that “Bitcoin has NEVER reclaimed the 50-week moving average in a bear market year.” The significance lies in market psychology and technical structure. A successful reclaim above this level would represent a break from historical bear market patterns, potentially signaling a structural shift in market conditions.
The 50-week SMA serves as a crucial long-term trend indicator for institutional and retail investors alike. Price originally fell below this moving average at the beginning of November, contributing to bearish sentiment throughout the subsequent period. A reclaim would not only represent technical progress but could fundamentally alter market participants’ perception of the current cycle.
Bull Market Support Band Dynamics
Above the 50-week SMA lies another critical technical formation: the bull market support band. This band consists of two additional moving averages that have historically provided both support during uptrends and resistance during downtrends. Currently positioned as overhead resistance, this band represents the next significant technical hurdle should Bitcoin successfully reclaim the $101,000 level.
Trader Daan Crypto Trades commented on this dynamic, noting that “there’s a good chance we retest the bull market support band relatively soon. It’s moving down at a fast pace while price is attempting to grind higher.” This convergence of descending resistance and ascending price creates what technical analysts describe as a compression pattern, typically preceding significant directional moves.
The interaction between price and this support band has historically provided valuable information about market structure. Each major market cycle has featured decisive reactions at this technical level, making the upcoming test particularly significant for determining medium-term trajectory.
Market Context and Comparative Analysis
The current technical developments occur within a broader market context that includes several unique factors. Unlike previous bear market periods, the cryptocurrency ecosystem now features more mature derivatives markets, increased institutional participation, and evolving regulatory frameworks. These structural changes may influence how technical patterns manifest compared to historical precedents.
Additionally, macroeconomic conditions differ substantially from previous Bitcoin cycles. Interest rate environments, inflation metrics, and global economic growth projections all contribute to the backdrop against which these technical signals emerge. Analysts must consider both the pure technical patterns and their interaction with these external factors when evaluating potential outcomes.
The table below summarizes key technical levels and their significance:
| Technical Level | Price Approximation | Significance |
|---|---|---|
| 50-Week SMA | $101,000 | Never reclaimed in bear market; historic resistance |
| Bull Market Support Band | Above $101,000 | Key resistance zone; pivot point for trend direction |
| Recent Support | $90,000 | Tested successfully last week; established base |
| RSI 50 Level | N/A | Bullish momentum confirmation; first since October |
Analyst Perspectives and Market Sentiment
Market sentiment appears cautiously optimistic among technical analysts, though opinions vary regarding the sustainability of current movements. Some emphasize the uniqueness of the potential 50-week SMA reclaim, suggesting it could signal a fundamental shift in market structure. Others maintain a more conservative outlook, noting that resistance tests often involve volatility and potential reversals.
The consensus among chart analysts suggests that the coming weeks will provide crucial information about market direction. The interaction between price and the identified technical levels will likely determine whether current signals represent a genuine trend reversal or a bear market rally within a larger downward structure.
Importantly, multiple analysts reference historical patterns where similar technical setups preceded significant market movements. While past performance never guarantees future results, these historical parallels provide context for evaluating probability scenarios and potential risk-reward dynamics.
Risk Considerations and Market Dynamics
While technical indicators suggest bullish potential, several risk factors warrant consideration. Market volatility remains elevated compared to traditional asset classes, and cryptocurrency markets frequently exhibit rapid sentiment shifts. Additionally, the unique nature of the potential 50-week SMA reclaim means there’s limited historical precedent for this specific scenario.
Other considerations include:
- Volume confirmation: Sustainable moves typically require increasing trading volume
- Timeframe alignment: Signals across multiple timeframes increase reliability
- External catalysts: Macroeconomic developments can override technical patterns
- Market structure: Derivatives positioning may influence spot price movements
These factors collectively create a complex analytical environment where technical signals provide valuable information but must be interpreted within broader context. Successful navigation requires balancing technical analysis with awareness of fundamental developments and market structure considerations.
Conclusion
Bitcoin price action currently presents a compelling technical picture as multiple indicators align in bullish formation. The potential reclaim of the $101,000 level, representing the 50-week simple moving average, carries particular historical significance as an unprecedented event in Bitcoin bear market history. While technical analysis suggests continued upward potential, market participants must consider the unique context of this development alongside broader market dynamics. The coming weeks will likely provide decisive information about whether current signals represent a genuine trend reversal or a bear market rally, making careful observation and risk management essential for all market participants.
FAQs
Q1: What does Bitcoin’s RSI above 50 indicate?
The RSI (Relative Strength Index) above 50 typically signals bullish momentum and suggests buying pressure may be increasing. When combined with other indicators like MACD, it often confirms trend reversals or continuations.
Q2: Why is the $101,000 level significant for Bitcoin?
The $101,000 level represents Bitcoin’s 50-week simple moving average, a key long-term trend indicator. Historically, Bitcoin has never reclaimed this level during what technical analysts classify as a bear market year, making a potential breakthrough particularly significant.
Q3: What is a hidden bullish divergence?
A hidden bullish divergence occurs when the price forms a higher low while the RSI indicator forms a lower low. This pattern often signals continuation of an existing trend rather than reversal and suggests underlying strength despite apparent weakness in momentum indicators.
Q4: How reliable are MACD signals for Bitcoin price predictions?
MACD signals provide valuable information about momentum shifts but should not be used in isolation. Their reliability increases when confirmed by other indicators, multiple timeframes, and volume analysis within the context of broader market conditions.
Q5: What happens if Bitcoin fails to reclaim the $101,000 level?
Failure to reclaim the 50-week SMA would maintain the current bear market structure according to technical analysis. This could lead to retesting of lower support levels and potentially extend the consolidation or downward phase of the market cycle.