BTC Perpetual Futures Reveal Cautious Optimism: Long Positions Hold Slight Edge on Top Exchanges
Global cryptocurrency markets on March 21, 2025, exhibited a nuanced sentiment signal as aggregate data from the world’s three largest derivatives exchanges showed a marginal majority of traders positioned for Bitcoin’s price to rise. Specifically, the combined BTC perpetual futures long/short ratio stood at 51.04% long versus 48.96% short over the preceding 24-hour period. This subtle tilt, while statistically narrow, offers a critical snapshot of trader psychology and risk appetite at a pivotal moment for digital asset markets. Consequently, understanding the breakdown across individual platforms like Binance, OKX, and Bybit provides deeper insight into the fragmented yet interconnected nature of modern crypto trading.
Decoding the BTC Perpetual Futures Long/Short Ratio
The long/short ratio for BTC perpetual futures serves as a fundamental gauge of market sentiment. Essentially, it measures the proportion of open leveraged positions betting on price increases (longs) against those betting on decreases (shorts). A ratio above 50% long indicates a bullish aggregate bias, while below 50% suggests bearishness. However, analysts consistently warn against simplistic interpretations. For instance, extreme readings often act as contrarian indicators, signaling potential market tops or bottoms. Therefore, the current aggregate figure of 51.04% long reflects a market in a state of cautious equilibrium, not exuberant speculation.
Perpetual futures themselves are unique instruments. Unlike traditional futures, they lack an expiry date, allowing traders to hold positions indefinitely provided they fund a periodic ‘funding rate’. This rate exchanges between long and short positions to tether the contract price to the underlying spot asset. The funding rate mechanism becomes particularly relevant when long/short ratios become skewed, as it incentivizes balance. The data from March 20-21, 2025, shows ratios that likely corresponded with neutral or slightly positive funding rates, minimizing external pressure for position adjustment.
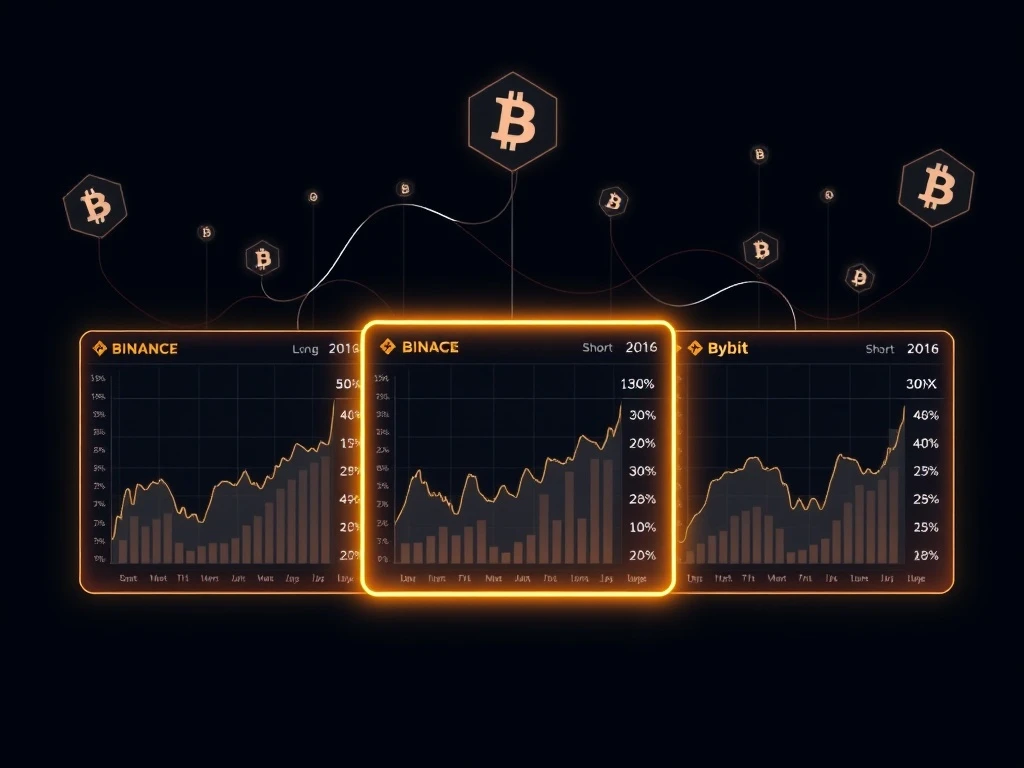
Exchange-by-Exchange Breakdown: Binance, OKX, and Bybit
A granular view reveals subtle but meaningful differences in trader positioning across leading venues. These variations stem from differing user demographics, geographic concentrations, and product structures.
- Binance: The global exchange leader reported a ratio of 51.18% long to 48.82% short. This alignment almost perfectly with the aggregate figure underscores Binance’s massive market share and its role as a bellwether for global retail and institutional sentiment.
- OKX: Showing the most bullish skew among the trio, OKX recorded 51.27% long versus 48.73% short. This minor elevation may reflect regional sentiment trends or platform-specific trading community behaviors.
- Bybit: Presenting the most balanced picture, Bybit’s ratio was nearly even at 50.17% long to 49.83% short. This near-parity often characterizes platforms with sophisticated high-frequency and algorithmic trading cohorts.
| Exchange | Long % | Short % | Net Bias |
|---|---|---|---|
| Binance | 51.18% | 48.82% | +2.36% |
| OKX | 51.27% | 48.73% | +2.54% |
| Bybit | 50.17% | 49.83% | +0.34% |
| Aggregate | 51.04% | 48.96% | +2.08% |
These figures, while stable in the short term, are inherently dynamic. They fluctuate with price movements, news events, and macroeconomic data releases. A key metric for context is total open interest—the sum of all outstanding contracts. High open interest alongside a balanced ratio suggests a mature, liquid market, whereas a skewed ratio with surging interest can signal an impending volatile move.
The Broader Context: Market Mechanics and Sentiment Indicators
Interpreting these BTC perpetual futures ratios requires integration with other market data. For example, spot market volumes, options put/call ratios, and fear and greed indices provide a multidimensional view. When perpetual futures show a slight long bias while options markets exhibit hedging (e.g., buying puts), it reveals a complex strategy of directional bets with insurance. Furthermore, the timing of this data is crucial. It captures sentiment following a period of consolidation, making the slight bullish lean more significant than if it occurred after a sharp rally.
Historical analysis shows that sustained periods where the aggregate long ratio remains between 50% and 55% often precede gradual, trending price action rather than explosive moves. Conversely, ratios exceeding 60% or dropping below 40% have frequently marked local sentiment extremes. The current data from Binance, OKX, and Bybit, therefore, paints a picture of a market in a healthy, undecided state. This equilibrium allows for movement in either direction based on new fundamental catalysts.
Expert Perspective on Ratio Analysis and Risk
Seasoned derivatives traders emphasize that raw long/short percentages are just the starting point. “The devil is in the details of position size and leverage,” notes a veteran analyst from a quantitative crypto fund. “A 51% long ratio comprised of highly leveraged retail positions carries different systemic risk than the same ratio dominated by low-leverage institutions.” Monitoring liquidations is also paramount. A market with a balanced ratio but high estimated liquidation levels near the current price is fragile. Fortunately, current liquidation heatmaps for BTC suggest clusters are not immediately threatening, supporting the stability implied by the ratios.
Another critical factor is the influence of market makers and arbitrage desks. These entities often run market-neutral strategies that can obscure true directional sentiment in the raw data. Their hedging activity across spot, perpetuals, and dated futures can create synthetic long or short exposure that doesn’t reflect a pure price bet. This activity partially explains why ratios rarely reach extreme levels on major, liquid exchanges like these three.
Conclusion
The latest BTC perpetual futures long/short ratios from Binance, OKX, and Bybit collectively signal a market characterized by cautious optimism and a lack of strong consensus. The aggregate tilt of 51.04% long to 48.96% short indicates a minor bullish bias, but one that is far from conclusive. For traders and analysts, this data point is most valuable when combined with trends in open interest, funding rates, and spot price action. Ultimately, the near-parity across these major exchanges suggests a waiting game, with participants positioned for movement but not yet committed to a strong directional breakout. Monitoring shifts in these ratios will remain essential for gauging the next significant move in Bitcoin’s price.
FAQs
Q1: What does a BTC perpetual futures long/short ratio of 51% long mean?
It means that, across all open perpetual futures contracts, 51% of traders by position count are betting the price will go up (long), and 49% are betting it will go down (short). It indicates a slight, but not overwhelming, bullish sentiment.
Q2: Why do the ratios differ between Binance, OKX, and Bybit?
Differences arise from variations in user base demographics, regional trader sentiment, the prevalence of algorithmic trading, and the specific leverage products offered on each platform.
Q3: Is a higher long percentage always good for Bitcoin’s price?
Not necessarily. While it shows buying interest, an excessively high long percentage (e.g., over 65%) can indicate overcrowding and often precedes sharp downside corrections as over-leveraged longs get liquidated.
Q4: How often do these long/short ratios change?
They update in real-time as traders open and close positions. Significant news events or large price movements can cause rapid shifts in the ratios within minutes or hours.
Q5: How should a trader use this data?
As one of several sentiment indicators. It should be combined with technical analysis, on-chain data, and options market activity to form a more complete market view, not used in isolation for trading decisions.