Crypto Fear & Greed Index Surges into ‘Greed’ Territory, Signaling a Dramatic Shift in Investor Psychology
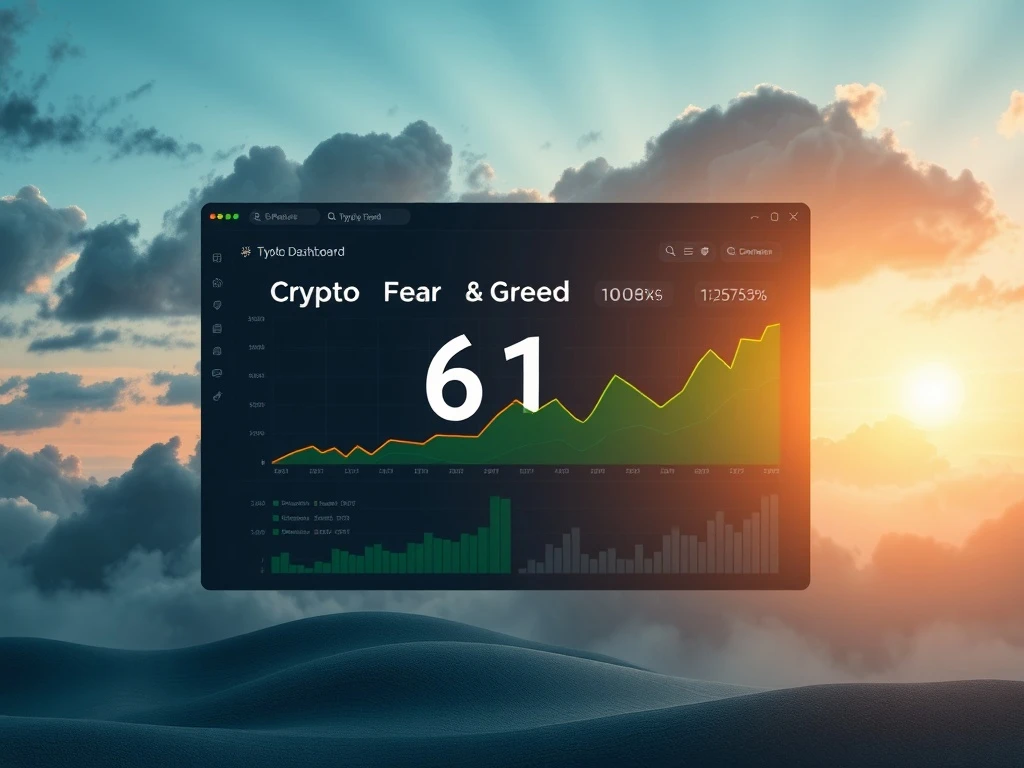
A significant psychological shift is rippling through the cryptocurrency markets as the widely watched Crypto Fear & Greed Index has decisively entered ‘Greed’ territory for the first time in over three months. This pivotal move, recorded on January 24, 2025, marks a stark reversal from the prolonged period of caution and fear that dominated the closing quarter of the previous year. The index’s 13-point surge to a reading of 61 provides a quantifiable measure of improving investor confidence, potentially heralding a new phase for digital asset valuations.
The Crypto Fear & Greed Index Enters a Critical Phase
According to data from market analytics provider Alternative.me, the Crypto Fear & Greed Index now sits at 61. This reading places it firmly within the ‘Greed’ classification for the first time since October 10, 2024. That previous date is notably etched in market history, coinciding with a severe forced liquidation event that cascaded through derivatives markets. Consequently, the index’s return to this level represents a meaningful recovery in market psyche. The tool itself serves as a daily sentiment thermometer, aggregating multiple data points to gauge the emotional temperature of cryptocurrency traders and investors.
The index operates on a straightforward scale from 0 to 100. A score of 0 signifies ‘Extreme Fear,’ often seen during market capitulation, while 100 represents ‘Extreme Greed,’ typically associated with market tops and euphoria. The current reading of 61 suggests a market that is optimistic and leaning toward risk-taking, but not yet in the dangerous territory of irrational exuberance. This measured ascent is often viewed more favorably by analysts than a sudden, vertical spike.
Decoding the Sentiment Engine: How the Index is Calculated
The index’s methodology is transparent and data-driven, designed to minimize bias. It synthesizes six core components, each weighted to reflect its influence on market sentiment:
- Volatility (25%): Current price fluctuations are compared to historical averages. High volatility often correlates with fear, while low, steady volatility can indicate complacency or greed.
- Market Momentum/Volume (25%): This measures trading volume and recent price trends. Sustained high volume on upward price moves strongly contributes to a ‘Greed’ reading.
- Social Media (15%): The pace and tone of discussions on platforms like Twitter and Reddit are analyzed. A surge in positive mentions and hashtag volume can signal growing greed.
- Surveys (15%): Periodic polls of the cryptocurrency community provide direct insight into crowd psychology.
- Dominance (10%): Bitcoin’s share of the total cryptocurrency market cap is tracked. Rising dominance can indicate a ‘flight to safety’ (fear), while altcoins gaining share can signal risk appetite (greed).
- Trends (10%): Google search volume for cryptocurrency-related terms is analyzed. Spiking search interest often accompanies major price moves and shifting sentiment.
This multi-factor approach ensures the index is not reliant on any single metric, providing a more robust and nuanced view of market emotion.
Historical Context and Market Cycles
The index’s utility lies in its historical context. Analysts frequently observe that sustained periods of ‘Extreme Fear’ can present accumulation opportunities for long-term investors, while prolonged ‘Extreme Greed’ has often preceded significant market corrections. For instance, the index hovered at or above 90 during the peak euphoria of late 2017 and again in early 2021, both periods followed by major downturns. Conversely, readings deep in ‘Extreme Fear’ territory were recorded during the March 2020 COVID crash and the November 2022 FTX collapse, which later proved to be cyclical bottoms.
The journey from the October 2024 lows to the current ‘Greed’ reading illustrates a classic sentiment cycle. The forced liquidation event created a sentiment vacuum of extreme fear. The subsequent months likely saw a grind of consolidation and hesitant recovery, which the index would have reflected as ‘Neutral’ or ‘Fear’ readings. The recent sharp jump to 61 suggests this recovery phase has accelerated, breaking through a key psychological barrier.
Implications for Traders and the Broader Crypto Ecosystem
The shift into ‘Greed’ territory carries several immediate implications. Firstly, it often correlates with increased retail investor interest, as evidenced by rising Google search volume and social media activity. This can lead to higher trading volumes and liquidity across exchanges. Secondly, for institutional participants, sentiment indicators are one component in a larger risk-assessment framework. A move to ‘Greed’ may prompt some funds to reassess position sizing or hedging strategies.
Furthermore, the sentiment shift can have a reflexive effect on the market itself. Positive sentiment can fuel further buying, creating a short-term virtuous cycle. However, seasoned market participants view the index as a contrarian indicator at extremes. While a reading of 61 is not extreme, it serves as a caution to monitor other on-chain and fundamental data. Key metrics to watch alongside sentiment include:
- Exchange net flows (are coins moving to or from custody?)
- Network activity and transaction fees
- Macroeconomic factors like interest rate expectations
The following table contrasts typical market characteristics during ‘Fear’ and ‘Greed’ phases as defined by the index:
| Phase (Index Range) | Typical Market Characteristics | Common Investor Behavior |
|---|---|---|
| Extreme Fear (0-25) | High volatility, negative news dominance, falling volumes. | Panic selling, disengagement, seeking safety. |
| Fear (26-45) | Elevated volatility, cautious price action, mixed news flow. | Hesitation, waiting for confirmation, reduced risk exposure. |
| Neutral (46-54) | Moderate volatility, balanced news, steady volumes. | Indecision, range-bound trading strategies. |
| Greed (55-75) | Strong upward momentum, positive news cycle, rising volumes. | FOMO (Fear Of Missing Out), increased risk-taking, leverage use. |
| Extreme Greed (76-100) | Parabolic price moves, overwhelmingly bullish narrative, peak volumes. | Euphoria, disregard for risk, maximum leverage. |
Conclusion
The Crypto Fear & Greed Index’s entry into ‘Greed’ territory is a notable milestone for the digital asset market, symbolizing a recovery in collective investor confidence after a challenging period. This data-driven sentiment gauge provides a crucial, objective lens through which to view market psychology, complementing traditional technical and fundamental analysis. While the shift indicates a healthier, more optimistic market environment, it also reminds investors that sentiment is cyclical. Monitoring the evolution of the Crypto Fear & Greed Index, alongside robust fundamental data, will be essential for navigating the potential opportunities and risks that characterize the dynamic cryptocurrency landscape in 2025.
FAQs
Q1: What does a ‘Greed’ reading on the Crypto Fear & Greed Index mean?
A ‘Greed’ reading, typically between 55 and 75, indicates that market sentiment is optimistic and leaning toward risk-taking. It often coincides with rising prices, increased trading volume, and a positive news cycle, suggesting investors are confident and experiencing FOMO (Fear Of Missing Out).
Q2: Is the Crypto Fear & Greed Index a reliable predictor of future price moves?
The index is a reliable indicator of current market sentiment, not a direct price predictor. Historically, sustained periods at extreme levels (‘Extreme Fear’ or ‘Extreme Greed’) have often preceded market reversals. However, sentiment can remain in ‘Greed’ or ‘Fear’ for extended periods during strong trends.
Q3: How often is the Crypto Fear & Greed Index updated?
The index is updated daily, usually within an hour of the market close, providing a fresh snapshot of market sentiment. Historical data is freely available on its website, allowing for analysis of sentiment trends over time.
Q4: Does the index only measure sentiment for Bitcoin?
While Bitcoin’s market dominance is a 10% component, the index is designed to measure sentiment for the broader cryptocurrency market. Its data sources—volatility, volume, social media, and searches—encompass the entire crypto ecosystem, making it a general market sentiment tool.
Q5: Should I buy or sell when the index is in ‘Greed’?
The index is a tool for context, not a standalone trading signal. A ‘Greed’ reading suggests the market is becoming optimistic. Prudent investors use this information to assess overall market risk, ensure their portfolio is aligned with their strategy, and avoid making decisions based purely on emotion. It is best used in conjunction with other forms of analysis.