Crypto Fear & Greed Index Reveals Crucial Shift: Market Sentiment Stabilizes at Neutral 48
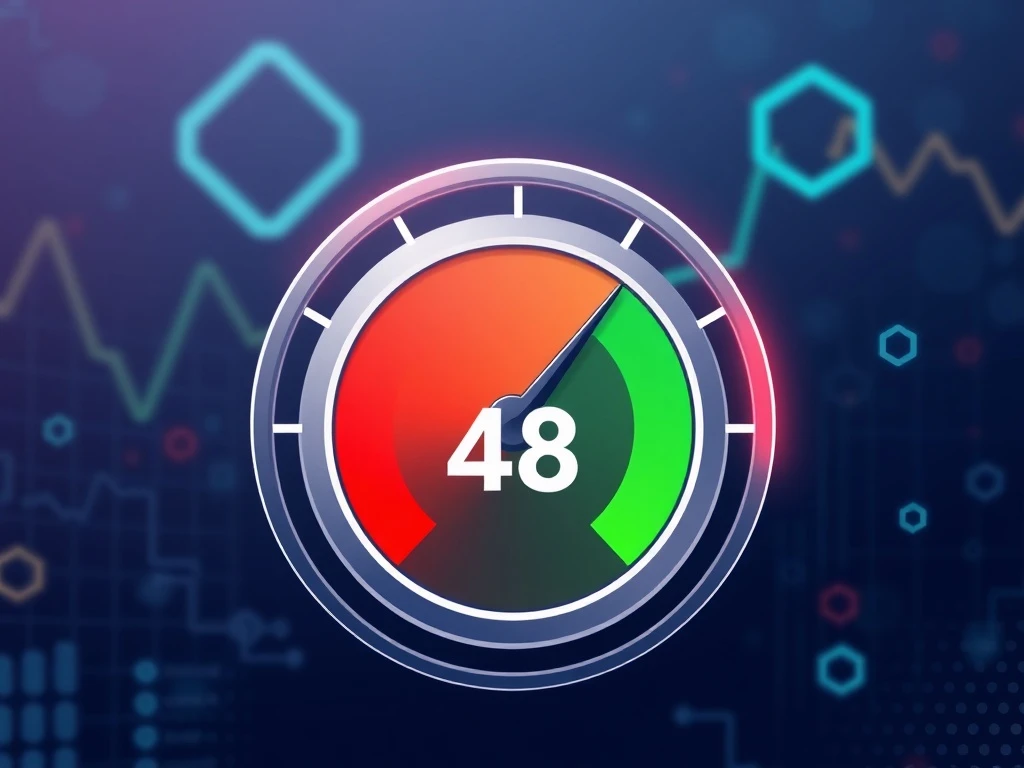
Global cryptocurrency markets witnessed a significant psychological shift this week as the widely monitored Crypto Fear & Greed Index climbed 22 points to settle at 48, officially entering ‘Neutral’ territory. This pivotal move, reported by data provider Alternative.me, marks a notable departure from the ‘Fear’ sentiment that has characterized recent trading periods. Consequently, analysts are now scrutinizing the underlying data for clues about the market’s next directional move.
Crypto Fear & Greed Index: Decoding the Shift to Neutral
The Crypto Fear & Greed Index serves as a crucial barometer for digital asset markets. It quantifies the emotional temperature of investors on a scale from 0 to 100. A reading of 0 indicates ‘Extreme Fear,’ while 100 signals ‘Extreme Greed.’ The jump to 48 represents a substantial 22-point surge from the previous day. This movement suggests a rapid recalibration of collective investor psychology. Market participants are digesting recent price action and macroeconomic signals. The index’s methodology relies on a multi-factor approach. It analyzes market volatility, trading volume, social media buzz, survey data, Bitcoin dominance, and search trends. Each component provides a unique lens on market behavior.
Historically, the ‘Neutral’ zone, typically between 40 and 60, often precedes periods of consolidation or trend definition. For context, during the bull market peaks of late 2021, the index frequently hovered in the ‘Extreme Greed’ range above 75. Conversely, following major market corrections, it has plunged into ‘Extreme Fear’ below 25. The current reading of 48, therefore, indicates a market in equilibrium. Investor emotions are neither overwhelmingly negative nor excessively optimistic. This balance can create a foundation for more rational, less sentiment-driven price discovery.
Anatomy of the Sentiment Gauge: How the Index is Calculated
Understanding the index’s construction is key to interpreting its message. The Crypto Fear & Greed Index is not a simple price tracker. It is a composite indicator built from six distinct data sources. Each source carries a specific weight in the final calculation. This design aims to capture a holistic view of market sentiment beyond mere price movements.
- Market Volatility (25%): This metric assesses the magnitude of recent price swings. Higher volatility often correlates with fear, while low volatility can indicate complacency or stability.
- Market Volume/Momentum (25%): This component examines trading volume and current price momentum relative to historical averages. Sustained high volume on upward moves can signal greed.
- Social Media (15%): The index scans platforms like Twitter and Reddit for the volume and sentiment of cryptocurrency mentions. A surge in positive chatter can lift the score.
- Surveys (15%): Poll data from various communities provides a direct snapshot of trader and investor outlook.
- Bitcoin Dominance (10%): This measures Bitcoin’s share of the total cryptocurrency market cap. Rising dominance can signal a ‘flight to safety’ during fear, while altcoin rallies often accompany greed.
- Google Trends (10%): Search volume for cryptocurrency-related terms offers insight into retail investor interest and curiosity.
The recent improvement to 48 points suggests positive contributions across several of these metrics. For instance, a stabilization in volatility, increased trading volume, or more balanced social media discourse could all be contributing factors. This multi-source approach helps mitigate the noise from any single data point.
Historical Context and Market Implications
Examining past behavior of the Crypto Fear & Greed Index provides valuable context. Periods where the index rebounds from ‘Fear’ into ‘Neutral’ have often coincided with local market bottoms or the beginning of consolidation phases. However, it is not a standalone timing tool. The index must be analyzed alongside fundamental on-chain data and macroeconomic conditions. For example, the current shift occurs amid evolving regulatory clarity in major economies and continued institutional adoption of blockchain infrastructure.
The move to a neutral reading of 48 may influence trader behavior. Some contrarian investors use extreme fear readings as potential buying opportunities. Conversely, extreme greed readings can serve as caution flags. A neutral reading, therefore, may lead to a reduction in these sentiment-driven tactical trades. Instead, focus may shift more decisively to project fundamentals, technological developments, and broader financial market trends. Market structure analysts note that neutral sentiment can reduce the likelihood of panic selling. It can also temper the irrational exuberance that fuels bubble-like conditions.
Bitcoin Dominance and the Broader Altcoin Market
The 10% weighting of Bitcoin dominance in the index is particularly noteworthy. Bitcoin often acts as a market bellwether. When fear grips the market, capital tends to flow back into Bitcoin from higher-risk altcoins. This increases its market share. A stable or declining Bitcoin dominance within a neutral sentiment environment can sometimes indicate growing investor confidence in alternative projects. It suggests a willingness to take on more risk across the ecosystem.
Current on-chain data for Bitcoin shows patterns often associated with accumulation by long-term holders. This activity frequently occurs during periods of neutral or fearful sentiment, not during peaks of greed. Meanwhile, the total value locked in decentralized finance protocols and non-fungible token trading volumes provide additional gauges for altcoin sector health. These metrics offer a more nuanced picture than price alone.
Conclusion
The Crypto Fear & Greed Index’s move to a neutral 48 represents a significant normalization of market psychology. It marks a departure from the fear that dominated recent quarters. This shift suggests investors are processing information more calmly. They are weighing risks and opportunities with greater equilibrium. However, the index is a measure of sentiment, not a crystal ball. Market participants should consider it as one tool among many. A comprehensive analysis requires reviewing on-chain metrics, regulatory developments, and global macro trends. The neutral reading provides a stable emotional foundation. The market’s next major trend will likely be driven by fundamental catalysts, not just sentiment alone.
FAQs
Q1: What does a Crypto Fear & Greed Index reading of 48 mean?
A reading of 48 falls into the ‘Neutral’ category. It indicates that overall market sentiment is balanced between fear and greed. This suggests a period where emotional trading may be less dominant, potentially allowing fundamentals to drive price action more clearly.
Q2: Who creates the Crypto Fear & Greed Index and how often is it updated?
The index is provided by Alternative.me. It aggregates data from multiple public sources in real-time. The index value is typically updated daily, providing a frequent snapshot of evolving market sentiment.
Q3: Is the Crypto Fear & Greed Index a reliable predictor of future price movements?
The index is a measure of current sentiment, not a direct price predictor. Historically, extreme readings (both fear and greed) have often preceded market reversals. However, neutral readings like 48 are less predictive of direction and instead signal a state of equilibrium.
Q4: Why is Bitcoin dominance part of the Fear & Greed Index calculation?
Bitcoin dominance measures Bitcoin’s market share relative to all other cryptocurrencies. In times of fear, investors often sell riskier altcoins and move into Bitcoin, seen as a more established ‘safe haven’ within crypto, thus increasing its dominance. This behavior makes it a useful sentiment indicator.
Q5: How should traders and investors use this information?
Investors can use the index as a contrarian indicator at extremes. A neutral reading suggests sentiment is not providing a strong directional bias. During such periods, focusing on fundamental analysis, project roadmaps, and macroeconomic factors becomes even more critical for decision-making.