Altcoin Season Index Stands at 26: A Revealing Signal of Bitcoin’s Current Market Dominance
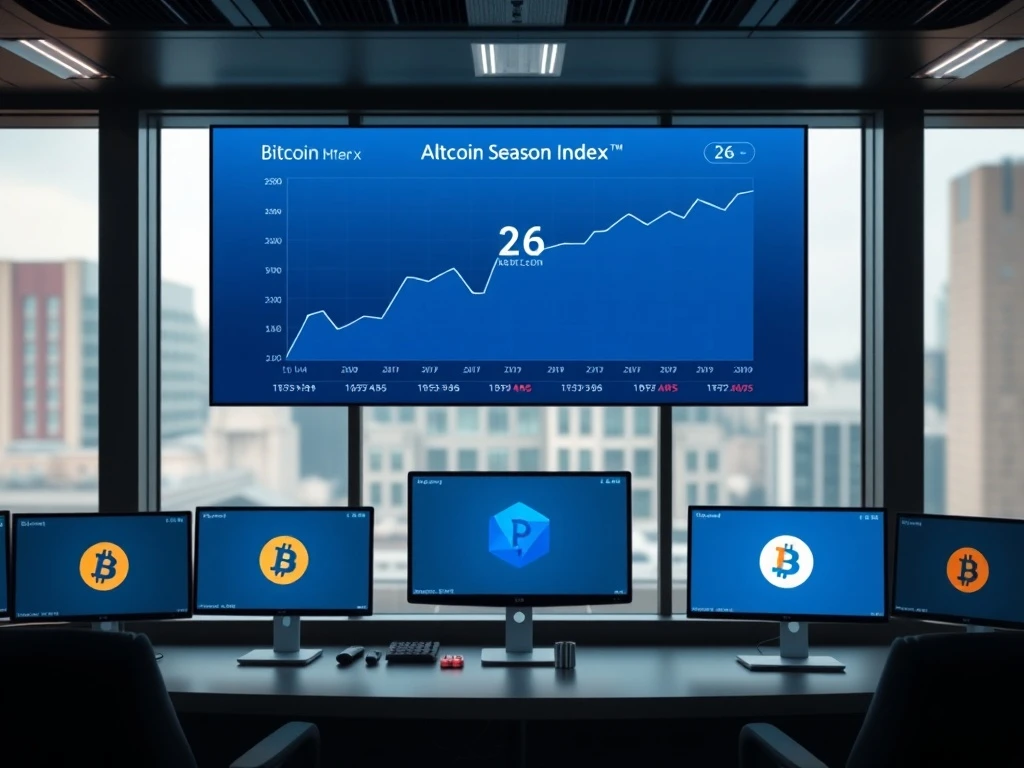
As of late April 2025, a critical metric for cryptocurrency investors, the Altcoin Season Index, firmly stands at 26. This reading, provided by the authoritative data aggregator CoinMarketCap, offers a stark and quantitative snapshot of the current market structure. Consequently, it signals a period overwhelmingly classified as a ‘Bitcoin season,’ where the pioneer cryptocurrency’s performance eclipses the broader altcoin market. This index provides a crucial, data-driven framework for understanding capital rotation and investor sentiment within the volatile digital asset space.
Decoding the Altcoin Season Index at 26
The Altcoin Season Index functions as a vital market barometer. Specifically, CoinMarketCap calculates it by analyzing the price performance of the top 100 cryptocurrencies, excluding stablecoins and wrapped tokens, against Bitcoin over a rolling 90-day window. A score of 26, therefore, is profoundly significant. It indicates that only a small fraction of major altcoins have managed to outperform Bitcoin during this three-month period. The threshold for declaring a full ‘altcoin season’ is notably high, requiring 75% of these assets to beat Bitcoin’s returns. Presently, the market remains far from this bullish altcoin scenario.
Historically, readings below 50 have consistently correlated with Bitcoin dominance phases. For instance, during the market consolidation in early 2023, the index frequently lingered between 20 and 40. Analysts from firms like Glassnode and Arcane Research have previously noted that sustained periods below 25 often precede or accompany institutional capital inflows primarily directed toward Bitcoin, seen as a relative ‘safe haven’ within crypto. This current level suggests a cautious or risk-off appetite among a significant portion of the market’s capital.
The Mechanics and Calculation Behind the Metric
Understanding the index’s construction is key to interpreting its message. The methodology is deliberately designed to filter noise and capture meaningful trends.
- Asset Selection: The index uses the top 100 cryptocurrencies by market capitalization, ensuring it reflects the most influential and liquid projects.
- Exclusions: It wisely removes stablecoins (like USDT, USDC) and wrapped tokens (like WBTC), as their prices are pegged and do not reflect independent performance.
- Time Frame: The 90-day period smooths out short-term volatility and identifies sustained momentum shifts.
- Binary Comparison: Each altcoin receives a simple ‘win’ or ‘loss’ based on whether it outperformed Bitcoin in that window.
The final index score represents the percentage of altcoins that ‘won.’ Therefore, a score of 26 means approximately 26 out of 100 top altcoins posted better returns than Bitcoin. This quantitative approach removes emotional bias from market cycle analysis.
Expert Context on Market Cycle Phases
Market strategists often reference a four-phase cycle: accumulation, markup, distribution, and markdown. The Altcoin Season Index at 26 typically aligns with the late accumulation or early markup phase for Bitcoin, where its strength becomes apparent before potential capital trickles down to altcoins. Veteran trader and analyst ‘Credible Crypto’ has frequently highlighted on social platforms that a rising Bitcoin dominance, reflected by a low altcoin index, is necessary to build a stable foundation for a broader market rally. Without Bitcoin attracting initial liquidity and setting a higher market floor, sustainable altcoin rallies struggle to materialize.
Historical Precedents and Predictive Power
Examining past data reveals patterns associated with the index’s position. The following table contrasts index levels with subsequent market behavior based on historical observations from 2019-2024:
| Index Range | Market Phase Designation | Typical Investor Sentiment | Common Subsequent Action |
|---|---|---|---|
| 0-25 | Strong Bitcoin Season | Risk-averse, cautious | Capital concentration into Bitcoin |
| 26-50 | Moderate Bitcoin Season | Selective, watchful | Bitcoin accumulation; research on altcoins |
| 51-74 | Transition / Neutral | Optimistic, anticipatory | Early rotation into high-cap altcoins |
| 75-100 | Altcoin Season | Risk-on, euphoric | Broad altcoin speculation and investment |
For example, the explosive altcoin season of Q4 2020-Q1 2021 was preceded by the index climbing from a low of 15 in September 2020 to break above 75 by December. The current reading of 26 places the market in a ‘Moderate Bitcoin Season.’ This phase has historically been a period of portfolio rebalancing for institutional funds, as reported by entities like Fidelity Digital Assets in their quarterly market reviews.
Implications for Crypto Investors and Traders
The index provides actionable intelligence for different market participants. For long-term investors, a low index may signal a time to prioritize Bitcoin allocation within a core portfolio strategy. Conversely, for active traders, it highlights the heightened relative strength of Bitcoin-centric trades. Importantly, a score of 26 does not mean altcoins are declining in absolute terms; it simply means they are underperforming Bitcoin. Many may still be posting positive gains, just at a slower rate.
Furthermore, sector rotation within the altcoin space often becomes more discernible during these periods. Historically, when the index is low, capital tends to flow into the most established ‘blue-chip’ altcoins with the strongest fundamentals, rather than speculative small-cap projects. This creates a tiered performance landscape even within the underperforming altcoin cohort.
The Role of Macroeconomic Factors
The current index reading cannot be divorced from the broader 2025 financial landscape. With shifting interest rate expectations and geopolitical tensions, Bitcoin’s narrative as ‘digital gold’ often strengthens. This macro-driven demand directly impacts the Altcoin Season Index, pulling its score downward as Bitcoin attracts disproportionate buying pressure. Analysis from Bloomberg Intelligence consistently draws correlations between rising real yields, dollar strength, and periods of elevated Bitcoin dominance.
Conclusion
The Altcoin Season Index standing at 26 offers a clear, data-centric narrative: the cryptocurrency market remains in a Bitcoin-dominant phase. This metric, grounded in the comparative performance of the top 100 assets, serves as an essential tool for cutting through market noise. While not a crystal ball, it provides a historical and analytical framework for understanding capital flows and cycle positioning. For investors, recognizing this ‘Bitcoin season’ is crucial for strategic asset allocation and setting realistic performance expectations for the broader altcoin market. Monitoring the Altcoin Season Index for a sustained move above 50 will be key for signaling the next potential phase of market-wide expansion.
FAQs
Q1: What does an Altcoin Season Index of 26 mean?
An index of 26 means only about 26% of the top 100 altcoins have outperformed Bitcoin over the past 90 days. This firmly indicates a ‘Bitcoin season,’ where Bitcoin is the market’s leading performer.
Q2: How is the Altcoin Season Index calculated?
CoinMarketCap calculates it by comparing the 90-day price performance of the top 100 cryptocurrencies (excluding stablecoins and wrapped tokens) against Bitcoin. The score is the percentage of those altcoins that outperformed BTC.
Q3: At what level does a true ‘altcoin season’ begin?
A true altcoin season is officially designated when the index sustains a reading at or above 75. This indicates at least 75 out of the top 100 altcoins are beating Bitcoin’s returns.
Q4: Is a low index bad for altcoins?
Not necessarily. It indicates relative underperformance compared to Bitcoin. Altcoins can still appreciate in value during a Bitcoin season, but typically at a slower rate. It often shifts investor focus toward quality and fundamentals.
Q5: How often should investors check the Altcoin Season Index?
As a medium-term trend indicator, checking weekly or bi-weekly is sufficient for most investors. Daily fluctuations are less meaningful than the sustained direction and level of the index over time.
Q6: Can the index predict the exact start of an altcoin bull run?
No single metric can predict exact market turns. However, a sustained rise in the index from low levels (like 26) toward 50 and above has historically been a reliable leading indicator of improving altcoin momentum and a potential upcoming altcoin season.