XRP Price: Crucial $3 Battle – Is a Monumental Breakout Imminent?
The XRP price currently faces a significant hurdle. It struggles to decisively break above the crucial $3 mark. Investors keenly watch for a potential XRP breakout. This pivotal moment could define its short-term trajectory. Many analysts remain confident, however. They foresee an imminent surge for Ripple XRP. This comprehensive XRP analysis explores both bullish and bearish scenarios. It also highlights critical XRP support levels.
XRP Price Battles Crucial Resistance
In the past week, the XRP price has repeatedly failed to conquer the $3 psychological resistance. This persistent struggle leaves many wondering about its next move. Despite this, expert XRP analysis suggests strong underlying momentum. Yashu Gola reported this trend just minutes ago. XRP has, in fact, tumbled over 20% since last month’s peak near $3.66. A recent 4% drop pushed it below the key $3 level. Can it reclaim this mark as support? Will it continue its rally afterward? Let’s explore what top analysts predict.

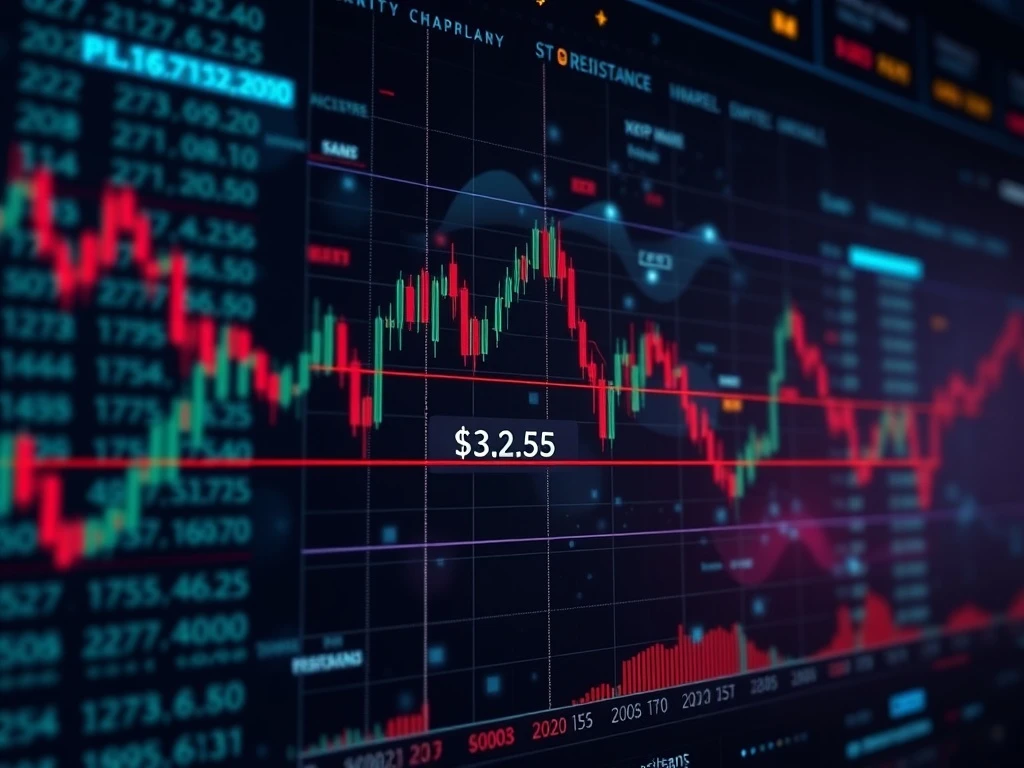
XRP/USD daily price chart. Source: TradingView
Bullish XRP Breakout Targets $4.40-$5.80
Optimism remains high among market watchers. Elliott Wave analyst Avi Harkishun, for instance, sees a clear path for XRP price. He suggests a rebound toward $4.00–$4.40 is quite possible. This scenario depends on one critical condition: XRP support around $2.95 must hold firm. Historically, the $2.95 zone acted as strong resistance. It later became crucial support after XRP’s earlier breakout this year. The target range of $4.00–$4.40 aligns with the 1.618 Fibonacci retracement level. This measurement comes from XRP’s swing high near $3.38 to its swing low around $1.61.

XRP/USD daily price chart. Source: TradingView/Avi Harkishun

XRP/USD two-week price chart. Source: TradingView

XRP/USD four-hour price chart. Source: TradingView
Ripple XRP: Bull Pennant and Cup-and-Handle Patterns Emerge
Several chartists echo this positive outlook. Pseudonymous analyst ThePenguinXBT, for example, views these range-high targets as a “good long opportunity.” Furthermore, Ripple XRP’s prevailing bull pennant pattern strengthens the case for an XRP breakout. This pattern hints at a potential move toward $4.40. Its technical upside target stands around $4.62. Another compelling bullish signal comes from AltcoinGordon. He highlights a classic cup-and-handle formation on Ripple XRP’s daily chart. The chart shows XRP entering the pattern’s handle stage. Here, the price consolidates in a tight range. This follows a U-shaped recovery. Technically, XRP’s consolidation could precede a breakout above the cup-and-handle’s neckline at $3.80.

XRP/USD daily price chart. Source: TradingView

XRP/USD daily price chart. Source; TradingView
Critical XRP Support and Ambitious Targets
Based on the measured move from the cup’s depth, the projected target is near $5.80. This marks roughly a 90% gain from current levels. For this ambitious target to materialize, XRP support at $2.95 is paramount. This level acts as a critical line in the sand for bullish scenarios. Losing this support could trigger a different price action. Therefore, traders closely monitor this key price point. The ongoing XRP analysis consistently points to its significance. Understanding these patterns helps in predicting future movements for Ripple XRP. The potential for a significant XRP breakout hinges on this support.
Deeper Correction: XRP Analysis for a Bearish XRP Price Scenario
A price drop below $2.95 could initiate a “WXY correction,” according to Elliott Wave analyst Harkishun. This pattern represents a longer pullback. Price drifts lower in three connected waves, instead of bouncing quickly. Consequently, this could extend XRP price’s decline toward $2.40. This level aligns with heavy trading activity from 2020–21. It also coincides with the 200-day exponential moving average (200-day EMA). The blue wave in the chart below illustrates this. Therefore, $2.40 becomes a logical support cushion in a bearish scenario. A bounce is likely from this point. Investors should consider both bullish and bearish possibilities. Prudent XRP analysis always includes potential downside risks. This holistic view is crucial for understanding the full scope of Ripple XRP’s potential movements.

XRP/USD daily price chart (zoomed). Source: TradingView/Avi Harkishun

XRP/USD daily price chart. Source: TradingView
This article does not contain investment advice or recommendations. Every investment and trading move involves risk. Readers should conduct their own research when making a decision.