Urgent: Bitcoin Price Breakdown Signals Potential $88,000 Target
The cryptocurrency market is currently witnessing a significant shift. **Bitcoin price**, the leading digital asset, has recently experienced a notable correction. This move follows its establishment of a new record high. Many technical indicators now suggest a potential for further declines. Market participants are closely watching key support levels. This analysis delves into the technical patterns and on-chain data influencing **BTC price** movements.
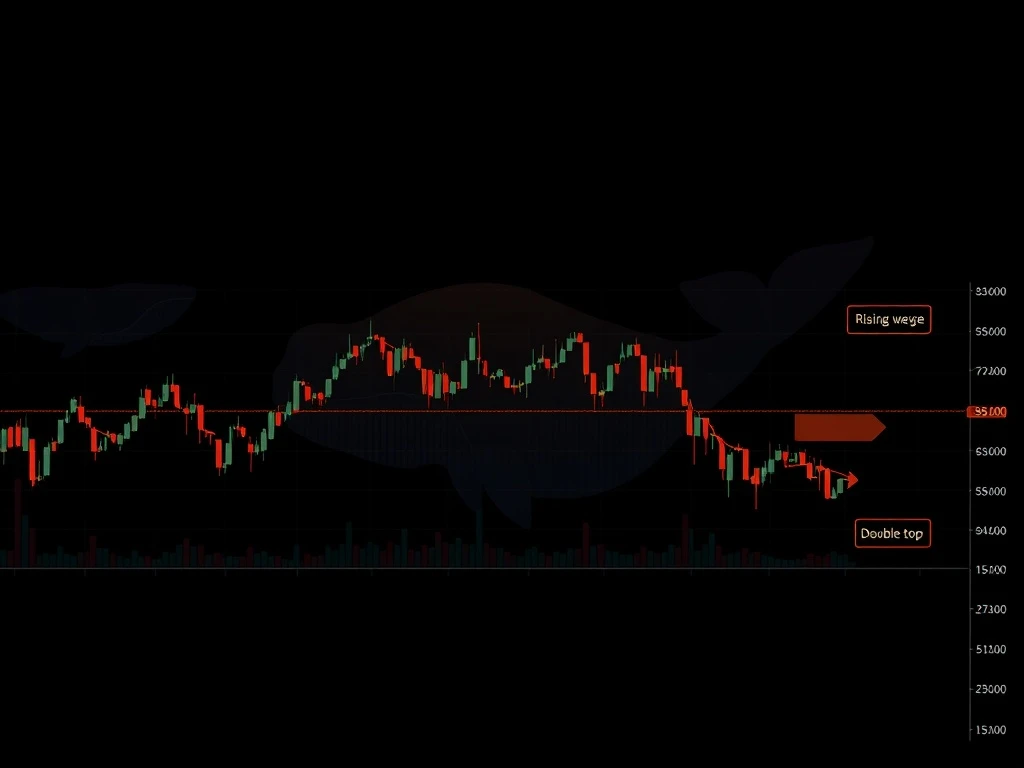
Understanding the Bitcoin Price Rising Wedge Breakdown
Bitcoin has confirmed a critical breakdown from its rising wedge pattern. This development occurred on the daily chart. Analyst Captain Faibik initially highlighted this formation. Traditional technical analysis views rising wedges as classic bearish reversal structures. They often precede sharp declines. This is especially true after a sustained uptrend. In Bitcoin’s specific case, the wedge began forming in April. It displayed higher highs and higher lows. These movements compressed towards the apex. The recent break below the pattern’s support trendline is a concerning signal. It points to a test of previously established resistance-turned-support levels. This breakdown signals weakening momentum. It also indicates rising seller pressure. The immediate support zone sits between **$110,000 and $112,000**. Losing this range could open the path further downwards. The next targets would be **$105,000 to $108,000**. Should selling pressure intensify, **BTC price** may extend its decline. It could reach the key **$98,000 to $100,000** psychological zone by September. This would represent a significant 20% correction from its recent peak.
A rising wedge’s breakdown target is calculated by subtracting the structure’s maximum height from the breakdown point. Applying this method to the current Bitcoin chart reveals a potential downside target. This target could be as low as **$88,000**. This level represents a substantial correction. Investors and traders should monitor these levels carefully. However, this bearish scenario would be invalidated. Bitcoin must hold strong above its 50-day exponential moving average (50-day EMA). This moving average has served as a robust support zone. It underpinned BTC’s impressive 50%-plus rise since April. If this support holds, the price will likely rebound. It could target the wedge’s upper trendline. This level sits around **$125,000** by September.
The Ominous Bitcoin Double Top Pattern and Its Implications
Bitcoin’s recent weekly close suggests the formation of a potential double top pattern. This pattern bears a striking resemblance to the one observed in 2021. A double top is a bearish reversal pattern. It is characterized by two consecutive peaks. These peaks occur around the same price level. This formation signals weakening buying momentum. It often precedes a significant market downturn. In 2021, this pattern was a precursor. It led to a dramatic 77% correction in Bitcoin’s value. BTC plummeted from approximately **$69,000 to below $16,000** in the subsequent months. A similar setup is now evident. This raises short-term downside risks for **BTC price**. The price must reverse quickly to avoid this outcome. According to analyst Swissblock, Bitcoin risks falling towards its 50-week EMA. This crucial moving average, often referred to as the red wave, sits around **$94,750**. This potential decline could materialize by September. This scenario would play out if the double top pattern unfolds similarly to 2021. The 50-week EMA has historically acted as a strong accumulation zone. This support has been particularly prominent since June 2023. Therefore, its breach would signal a significant bearish shift. Market participants should watch this level closely.
The comparison to 2021 highlights the potential severity of this pattern. While market conditions are never identical, historical patterns offer valuable insights. The double top indicates that buying pressure is diminishing. Sellers are gaining control. This suggests that the current rally may be losing steam. Traders often use such patterns to anticipate price reversals. They adjust their strategies accordingly. A confirmation of this pattern could lead to further sell-offs. This would push **Bitcoin price** lower. Conversely, a strong bounce from current levels could invalidate the pattern. This would require significant buying volume. Such a rebound would signal continued bullish sentiment. It would reinforce the market’s resilience.
Bitcoin Whale Activity: Unloading BTC Holdings
On-chain metrics further amplify the possibility of more price declines. These metrics focus on **Bitcoin whale activity**. The number of mega whale addresses has significantly decreased. These addresses hold over 10,000 BTC. Their count has dropped to its lowest level this year. Glassnode data confirms a sustained negative 30-day change. This trend has been observed since mid-July. Furthermore, whale wallets holding between 1,000 and 10,000 BTC have also shown a decline. This reflects clear profit-taking behavior. It occurred near Bitcoin’s recent highs. This whale-driven selling pressure is a critical factor. It increases the risk of a broader pullback. Strong spot demand is essential to counteract this. Without it, the market could face further downward pressure.
The actions of large holders often precede significant market moves. When whales begin to unload their holdings, it suggests a lack of confidence. It also indicates a desire to lock in profits. This selling pressure can overwhelm smaller buying orders. Consequently, it drives prices lower. This trend, combined with the technical patterns discussed, paints a cautious outlook. The market needs to see a resurgence of buying interest. This demand must come from retail and institutional investors. Only then can it absorb the selling pressure from these large entities. Monitoring **Bitcoin whale activity** provides crucial insights. It helps gauge the conviction of major market players. Their movements often dictate short-term market direction. Therefore, this metric is vital for any comprehensive **crypto market analysis**.
Macroeconomic Factors: Potential Fed Rate Cuts and Liquidity Shifts
There is a crucial distinction between the 2021 and current BTC price cycles. In 2021, Bitcoin peaked just as the Federal Reserve began its tapering process. This marked a shift towards quantitative tightening (QT). The current environment presents a different scenario. Odds now favor a 25-basis-point (bps) Fed rate cut in September. This is according to CME data. A rate cut would inject liquidity into the financial system. This could potentially offset some downside risks for Bitcoin. Lower interest rates generally make risk assets, like cryptocurrencies, more attractive. This is because traditional investments yield less. Therefore, a dovish Fed stance could provide a tailwind for crypto markets.
Additionally, the global money supply (M2) continues to grow persistently. This expansion hints at higher price targets for Bitcoin. Some analysts predict a **$132,000** price target in the coming months. Others even forecast BTC hitting **$170,000**. Such a liquidity shift could counterbalance technical weakness. It would support **Bitcoin price** in the short term. Swissblock suggests this shift could keep BTC’s broader uptrend intact. This macroeconomic factor introduces a layer of complexity. It could mitigate the bearish signals from technical analysis and whale movements. Investors should consider the interplay of these forces. The macro environment plays a significant role in long-term crypto valuations. A supportive monetary policy could indeed provide a floor for prices. It might even propel Bitcoin to new highs despite immediate technical concerns. Therefore, any comprehensive **crypto market analysis** must integrate these broader economic indicators.
Key Takeaways and Market Outlook
Bitcoin faces significant immediate challenges. The rising wedge breakdown is a clear bearish signal. It points to potential declines toward the **$88,000 to $94,750** range. The resemblance to the 2021 double top pattern further reinforces this cautious outlook. Moreover, **Bitcoin whale activity** shows profit-taking. This adds to the selling pressure. Large holders are reducing their exposure. This indicates a lack of conviction at current price levels. However, macroeconomic factors could provide a counterbalance. A potential Fed rate cut in September would inject liquidity. This could support risk assets. A persistently growing global money supply also suggests higher long-term price targets. These factors introduce an element of hope amidst the technical concerns. The market remains at a critical juncture. Monitoring key support levels is paramount. The 50-day EMA and the 50-week EMA are crucial. A strong rebound from these levels would be a positive sign. Conversely, a sustained break below them would confirm further downside. The coming weeks will be crucial for Bitcoin’s trajectory. Investors must remain vigilant. They should base decisions on thorough research and a balanced perspective.
This article does not contain investment advice or recommendations. Every investment and trading move involves risk, and readers should conduct their own research when making a decision.


