SUIUSDT Plunges 7.1%: Bearish Momentum Dominates Market Analysis
The SUIUSDT pair has taken a dramatic turn, plunging 7.1% in just 24 hours. This sharp decline has left traders scrambling as bearish momentum dominates the market. Let’s break down what happened and where this volatile asset might be headed next.
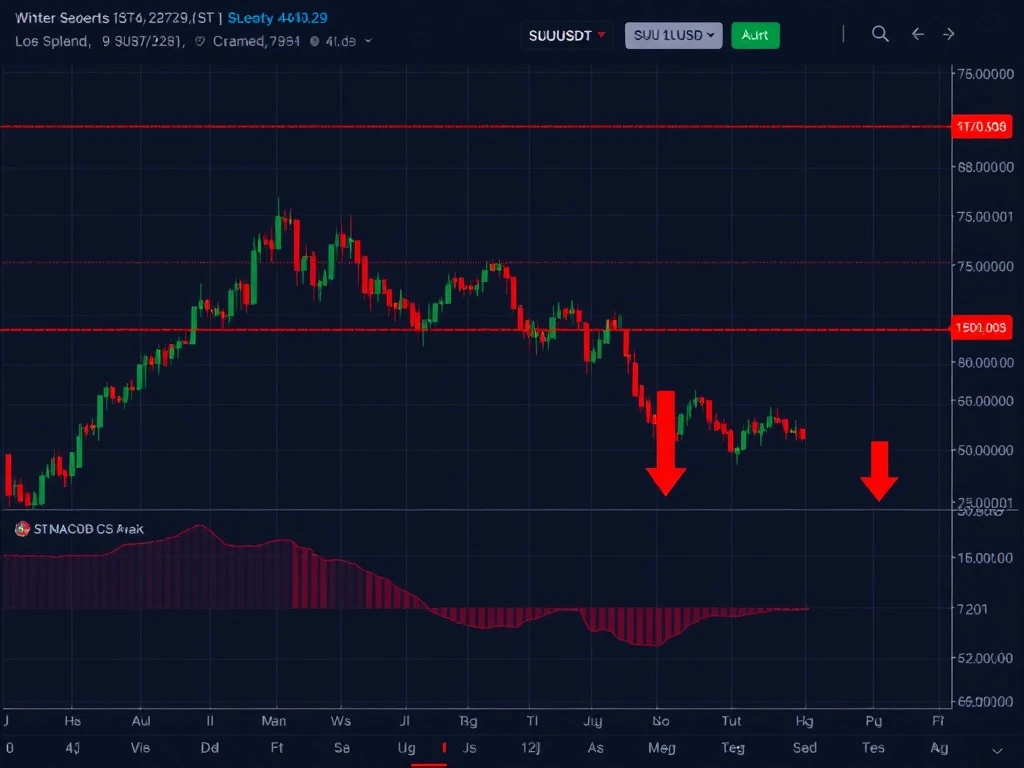
SUIUSDT Price Action: A Bearish Breakdown
The 15-minute chart tells a clear story of bearish momentum taking control. Key events included:
- Opening at $4.0927 before the steep decline
- Breaking through critical support at $4.00 and $3.90
- Forming a large bearish engulfing pattern midday
- Closing near the daily low at $3.7984
Technical Indicators Confirm Bearish Momentum
Multiple indicators aligned to signal strong selling pressure:
| Indicator | Signal |
|---|---|
| RSI | Dropped below 30 (oversold) |
| MACD | Remained below signal line |
| Moving Averages | Price below all key MAs |
| Bollinger Bands | Price touched lower band |
Fibonacci Retracement Levels to Watch
The 61.8% retracement level at $3.97 now serves as potential resistance. Key levels traders should monitor:
- Immediate support: $3.7697 (recent low)
- Potential resistance: $3.97 (61.8% Fib)
- Psychological barrier: $4.00
Crypto Volatility Spikes Amid Heavy Selling
The late afternoon saw turnover surge to $93,703,327.60 as crypto volatility reached extreme levels. Notable volume patterns:
- Highest volume at 14:00 ET
- No bottoming patterns detected
- Selling pressure remained consistent
Market Analysis: What’s Next for SUIUSDT?
The current technical setup suggests:
- Bearish momentum likely to continue short-term
- Any bounce could face resistance at Fib levels
- Macro factors could trigger sudden reversals
This intense period of crypto volatility serves as a reminder of how quickly market conditions can change. Traders should remain vigilant and watch key technical levels for potential entry or exit points.
Frequently Asked Questions
What caused the SUIUSDT price drop?
The 7.1% decline resulted from a combination of technical breakdowns below key support levels and strong bearish momentum confirmed by multiple indicators.
Is SUIUSDT oversold now?
While the RSI dipped below 30 (traditionally oversold), the lack of price reversal suggests bearish pressure remains strong.
What’s the most important level to watch now?
The $3.7697 support level and $3.97 Fibonacci retracement level are currently the most significant technical markers.
Could this be a buying opportunity?
While some traders look for oversold conditions, current market analysis suggests waiting for confirmation of a trend reversal before considering long positions.
How does this compare to broader market trends?
SUI’s movement was more volatile than many major cryptocurrencies during this period, highlighting its higher-risk nature.


