PEPEUSDT Plummets 7.3%: Critical Market Analysis and Trading Strategies for 2025-07-29
Did PEPEUSDT’s sharp 7.3% drop on 2025-07-29 catch you off guard? This comprehensive market analysis reveals the key patterns, indicators, and trading strategies you need to navigate volatile crypto markets effectively.
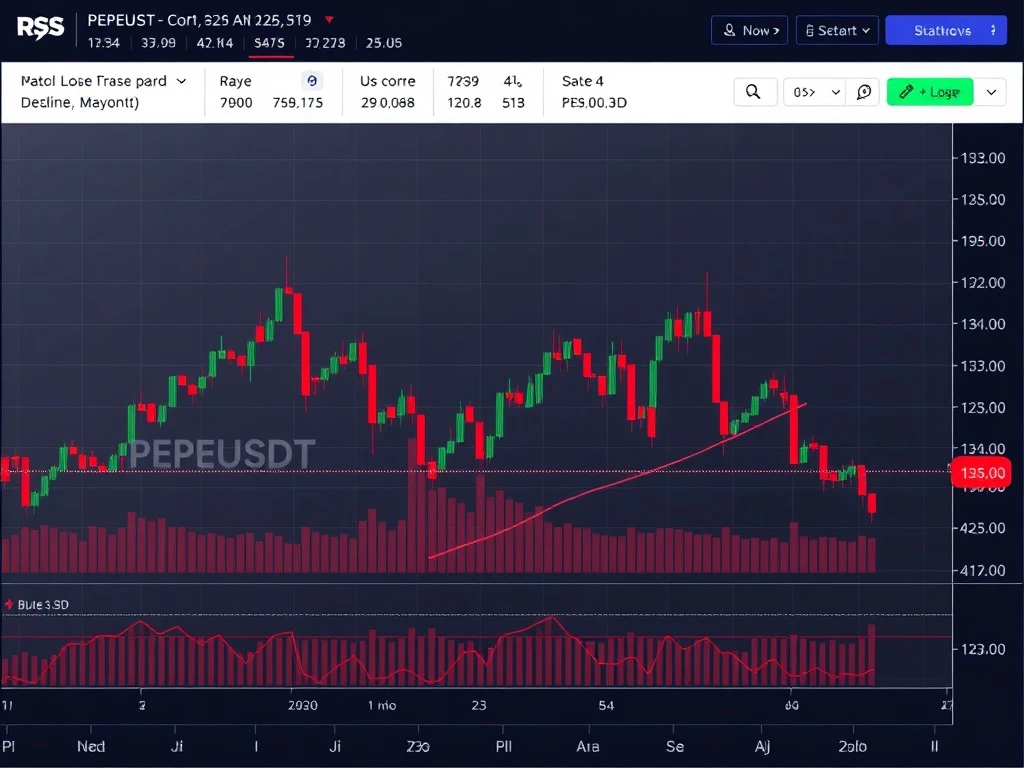
PEPEUSDT Price Action: Bearish Signals Dominate
The PEPEUSDT pair opened at $0.00001236 and closed at $0.00001149, forming clear bearish patterns:
- Series of lower highs and lower closes
- Bearish engulfing pattern between 22:45-23:00 ET
- Doji formation at 08:30 ET signaling potential exhaustion
Crypto Trading Indicators: What RSI and MACD Reveal
Technical indicators painted a concerning picture for PEPEUSDT traders:
| Indicator | Observation |
|---|---|
| RSI | Dropped below 30 (oversold) |
| MACD | Turned negative with expanding histogram |
| Bollinger Bands | Expanded significantly during selloff |
Market Analysis: Volume and Key Support Levels
The $1.989 trillion volume tells a story of strong selling pressure:
- Volume spiked between 00:00-06:00 ET during price drop
- Critical support at $0.00001139 held temporarily
- No bullish divergence observed in volume patterns
Trading Strategies for PEPEUSDT’s Next Move
Based on this market analysis, consider these approaches:
- Wait for RSI to exit oversold territory before long positions
- Monitor the $0.00001139 support level closely
- Watch for moving average crossovers as reversal signals
Bearish Patterns: When Might PEPEUSDT Recover?
While the current trend appears negative, these factors could signal a reversal:
- Sustained holding above $0.00001139 support
- RSI forming bullish divergence
- Volume decreasing on downward moves
The PEPEUSDT market on 2025-07-29 demonstrated classic bearish characteristics with strong selling pressure and concerning technical indicators. While oversold conditions may prompt a short-term bounce, traders should remain cautious until clear reversal signals emerge. Always remember to implement proper risk management in volatile crypto markets.
Frequently Asked Questions
What caused PEPEUSDT’s 7.3% drop?
The decline was driven by strong selling pressure evident in the volume surge and confirmed by multiple bearish technical indicators.
Is PEPEUSDT oversold now?
Yes, the RSI dropped below 30, indicating oversold conditions that often precede consolidation or reversal.
What are the key support levels to watch?
$0.00001149 and $0.00001139 are critical support levels that could determine the next major move.
Should I buy PEPEUSDT after this drop?
While oversold conditions exist, wait for confirmation of reversal signals before entering long positions.
How reliable are these technical patterns?
While technical analysis provides valuable insights, always combine it with other factors and risk management.


