SEI Price Struggles as 10-Day SMA at $0.34 Holds Firm – Will $0.3486 Resistance Break?
SEI’s price has dipped 3.1% as the 10-day SMA at $0.34 continues to act as a critical barrier. With resistance at $0.3486 holding strong, traders are watching closely for signs of a breakout or further decline. What does this mean for SEI’s short-term trajectory?
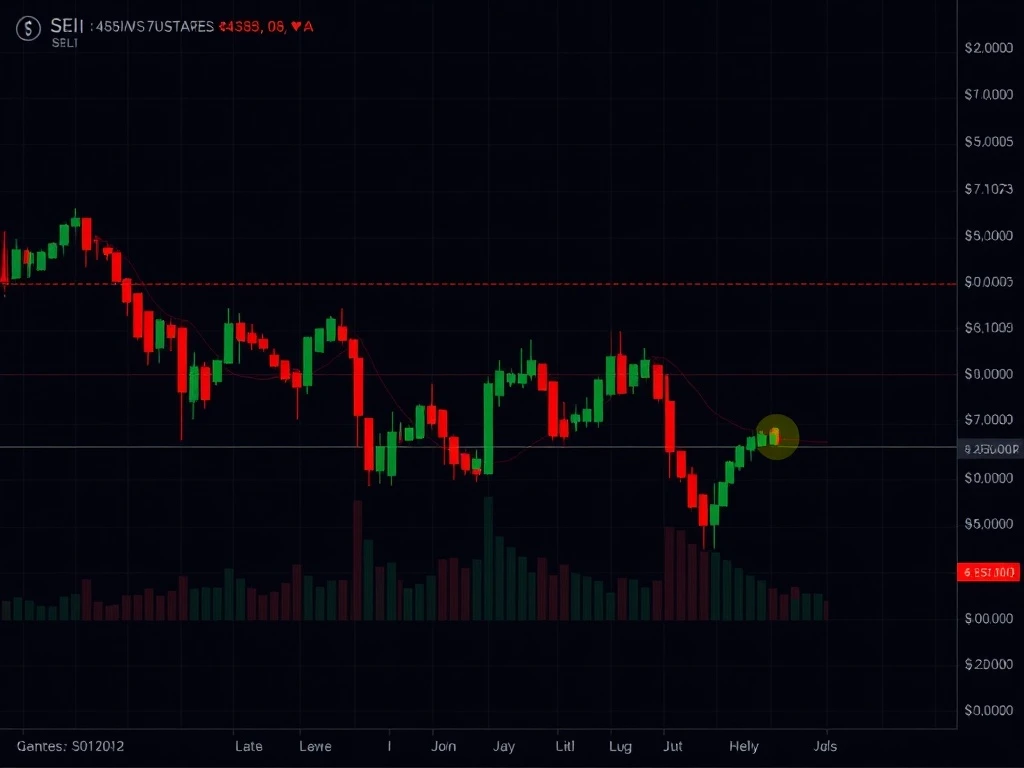
SEI Price Faces Strong Resistance at $0.3486
The SEI cryptocurrency remains trapped in a descending channel on the 3-day chart, with its price currently hovering near $0.3408. The asset has shown a 3.1% decline over the past week, with technical indicators pointing to the 10-day simple moving average (SMA) at $0.34 as a crucial level. Key observations:
- Support level holding at $0.329
- Resistance remains firm at $0.3486
- Descending trend established since early 2024
Why the 10-Day SMA Matters for SEI
The 10-day SMA has emerged as a dynamic zone influencing intraday trading decisions. Market participants have shown strong reactions when price attempts to breach or fall below this level. Recent trading volume patterns confirm the SMA’s importance in determining short-term momentum.
Potential Breakout Scenario for SEI
Analysts suggest that a sustained breakout above $0.3486 could trigger bullish momentum, potentially pushing the price toward $0.49. However, the downward channel remains a significant structural constraint. Key factors to watch:
| Level | Significance |
|---|---|
| $0.329 | Critical support |
| $0.34 | 10-day SMA pivot |
| $0.3486 | Immediate resistance |
| $0.49 | Potential target |
Market Sentiment and Trading Volume
Steady trading volume suggests traders are closely monitoring these key levels. A decisive breakout would not only validate higher targets but could also signal a shift in market sentiment. However, the descending channel’s integrity remains a formidable challenge.
Conclusion: Watch These Key Levels
SEI’s price action remains constrained between support and resistance, with the 10-day SMA serving as a critical pivot point. Traders should watch for volume spikes and price reactions near $0.3486 for potential breakout signals. While the current trend favors consolidation, a confirmed move above resistance could open the door to significant upside potential.
Frequently Asked Questions
What is the current support level for SEI?
The immediate support level stands at $0.329, which has held during recent tests.
Why is the 10-day SMA important for SEI?
The 10-day SMA at $0.34 has consistently acted as both support and resistance, making it a key reference point for traders.
What happens if SEI breaks $0.3486 resistance?
A sustained breakout above $0.3486 could trigger bullish momentum with a potential target of $0.49.
How long has SEI been in this descending channel?
The downward trend has been established since early 2024, with price action respecting the channel boundaries.
What trading volume patterns are significant?
Steady volume near key levels suggests strong trader interest, while spikes could indicate potential breakouts or breakdowns.


