Pump.fun Price: Crucial Test Looms as Bearish Signals Intensify
Are you tracking the volatile world of meme coins? Then you’ll want to pay close attention to the latest developments surrounding Pump.fun price (PUMP). This popular Solana-based platform token is currently navigating a precarious path, with key technical indicators flashing warnings of potential downward movement. Understanding these signals is crucial for anyone invested in the PUMP ecosystem.
Why is Pump.fun Price Under Such Intense Scrutiny?
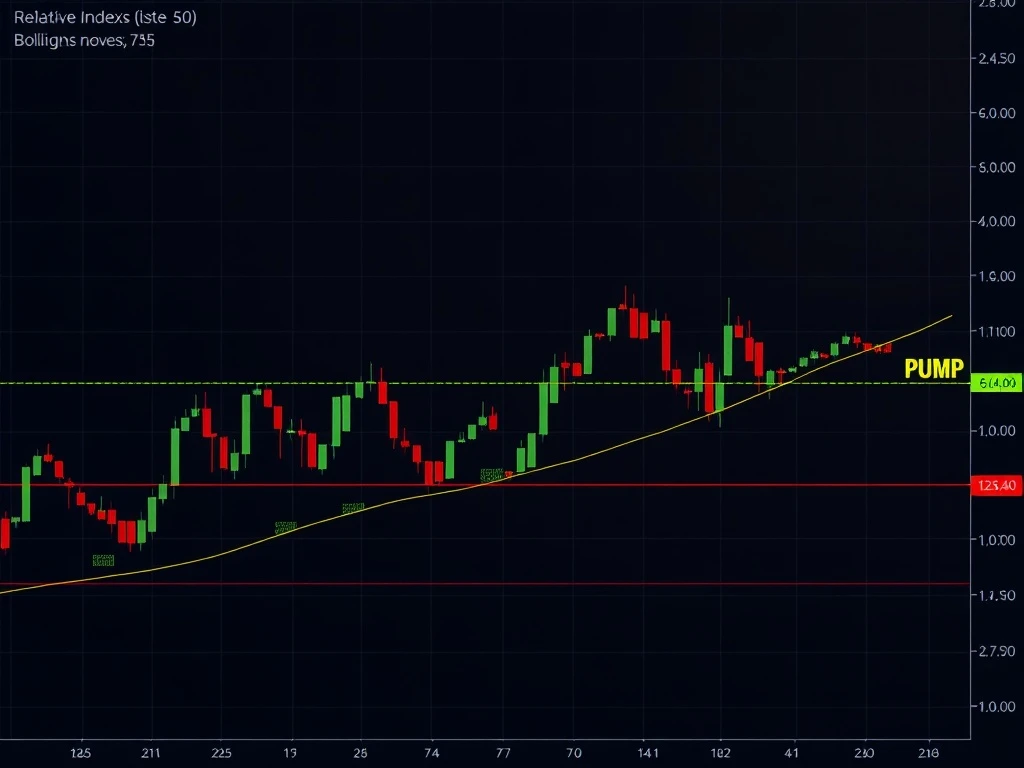
Pump.fun price is at a critical juncture, as technical indicators suggest heightened volatility and prevailing bearish momentum. The tightening of Bollinger Bands, a classic precursor to significant price swings, signals that a sharp movement is imminent. In the current market, conditions appear to favor a downward trajectory.
Concurrently, the Relative Strength Index (RSI) remains below the neutral 50.0 level. This sustained position below the midpoint underscores persistent selling pressure and weak bullish momentum, indicating that buyers are struggling to gain control. At its current trading level of $0.0027, PUMP is positioned near a key resistance level of $0.0029, while precariously holding above immediate support at $0.0024. This narrow trading range suggests a period of consolidation, yet it leaves the asset highly vulnerable to further declines if this crucial support is breached.
Decoding PUMP Crypto Volatility with Bollinger Bands
For traders and investors monitoring PUMP crypto, the convergence of Bollinger Bands is a significant signal. This pattern often precedes major price movements, and in Pump.fun’s case, it aligns with bearish signals observed in recent candlestick patterns. While prices have managed to stay above the basis line of the Bollinger Bands, weakening momentum increases the risk of a breakdown below the $0.0024 support. Such a breach could potentially drive the price further down towards $0.0021.
Conversely, a successful reclamation of the $0.0029 resistance level could trigger a rally, potentially pushing the price towards $0.0038. This would offer a much-needed reversal of the current downward trend. However, as analysts at COINOTAG note, such a reversal would necessitate a significant shift in market sentiment and a notable increase in buying interest.
A Technical Analysis of PUMP’s Crucial Support and Resistance Levels
A comprehensive technical analysis of PUMP highlights the strategic importance of two pivotal thresholds: $0.0024 and $0.0029. These levels are critical for traders assessing risk exposure and timing potential entries or exits. The proximity of these thresholds amplifies the stakes for PUMP holders, as even minor price deviations could have cascading effects on investor sentiment and market direction.
- Key Support at $0.0024: This level represents the immediate line of defense for PUMP. A sustained drop below $0.0024 would likely accelerate losses, potentially triggering further selling pressure.
- Key Resistance at $0.0029: Breaking above this level is crucial for any bullish reversal. A confirmed breakout could inject optimism into the market and pave the way for a rally towards higher targets like $0.0038.
- Potential Downside Target: If $0.0024 fails, the next significant support level is anticipated around $0.0021.
- Potential Upside Target: A strong move above $0.0029 could see PUMP aim for $0.0038.
The current consolidation phase, while seemingly stable, remains precarious given the fragile balance between these support and resistance levels.
What Does the RSI Indicator Tell Us About Pump.fun’s Future?
The RSI indicator‘s position below 50.0 further solidifies the prevailing bearish outlook for Pump.fun. This technical metric confirms that selling pressure dominates the market, with minimal likelihood of a short-term recovery. There are no immediate signs of a bullish reversal based on this momentum oscillator, suggesting that the path of least resistance remains downwards.
Market participants are strongly advised to monitor these key levels closely. A confirmed break below $0.0024 or a decisive move above $0.0029 will likely dictate the next phase of PUMP’s price movement. The interplay between tightening Bollinger Bands and the bearish RSI readings underscores the current fragility of PUMP’s price structure.
Navigating Volatility: Actionable Insights for PUMP Holders
As volatility rises, the likelihood of abrupt price movements increases, necessitating vigilance among market participants. Expert analysis from COINOTAG emphasizes the need for caution, given the alignment of bearish indicators and the absence of clear bullish catalysts. While the possibility of a short-term rally exists, it hinges entirely on PUMP’s ability to secure and maintain $0.0029 as a support level.
Without such a reversal, the prevailing technical conditions suggest continued downward momentum. Traders are urged to prioritize robust risk management strategies. This includes setting appropriate stop-loss orders to mitigate potential losses and carefully sizing positions to manage exposure in this highly volatile environment. The tightening bands, coupled with the RSI’s bearish positioning, create a scenario where even minor market shifts could trigger significant reactions, making informed decisions paramount.
Conclusion
Pump.fun (PUMP) is undeniably at a crossroads. The convergence of bearish signals from the RSI and Bollinger Bands paints a challenging picture for the token in the short term. While a potential rebound exists if key resistance is reclaimed, the current technical setup leans heavily towards continued downward pressure. Vigilance, sound technical analysis, and stringent risk management will be essential for navigating the coming days in the PUMP market. As always, do your own research and consider consulting with a financial advisor before making any investment decisions.
Frequently Asked Questions (FAQs)
Q1: What does the RSI below 50 mean for Pump.fun price?
An RSI (Relative Strength Index) reading below 50 indicates that selling pressure is currently dominating buying pressure. For Pump.fun (PUMP), it suggests weak bullish momentum and a higher likelihood of continued price declines in the short term.
Q2: How do Bollinger Bands affect Pump.fun’s price movement?
The tightening of Bollinger Bands on the Pump.fun chart signals a period of decreasing volatility, which often precedes a sharp price movement. In PUMP’s current situation, this tightening, combined with other bearish indicators, suggests an impending significant move, likely to the downside if support levels are breached.
Q3: What are the critical support and resistance levels for PUMP crypto?
For PUMP crypto, the crucial immediate support level is $0.0024. If this level breaks, the price could drop towards $0.0021. The key resistance level is $0.0029; a breakout above this could lead to a rally towards $0.0038.
Q4: Should I buy PUMP crypto now given the bearish signals?
The article highlights significant bearish signals, including RSI below 50 and tightening Bollinger Bands. This suggests caution. It is advisable for traders to monitor key support and resistance levels closely and implement robust risk management strategies, such as stop-loss orders, before making any investment decisions. Always conduct your own thorough research.
Q5: What is the significance of the $0.0024 support level for Pump.fun?
The $0.0024 support level is strategically important because it acts as the immediate defense for Pump.fun’s price. A sustained drop below this threshold would likely accelerate losses and could trigger further downward momentum, potentially pushing the price to lower targets.


