TIA Token Plummets: 8.9% Decline Ignites Bearish Fears After Critical EMA Breakdown
The crypto market is a rollercoaster, and for holders of Celestia’s native TIA token, the past 24 hours have certainly felt like a steep drop. In a move that has sent ripples through the altcoin community, the TIA token experienced a sharp 8.9% decline, plummeting below crucial support levels. What triggered this sudden downturn, and what does it mean for the future of Celestia’s promising modular blockchain?
Understanding the TIA Token’s Sudden Plunge
Celestia’s TIA token recently faced a significant setback, registering an 8.9% decline over a 24-hour period. Trading at $1.82, the token struggled to maintain its position above the critical $2.03 resistance zone. This failure initiated a cascading effect, leading to a breakdown below several key Exponential Moving Averages (EMAs) and pushing the token towards its immediate support level at $1.77.
The catalyst for this sharp drop was a decisive rejection from a long-term descending trendline, a formidable barrier that has shaped TIA’s market structure since January 2024. Despite earlier attempts to break free, the lack of sustained bullish momentum intensified selling pressure, confirming a shift in near-term direction. This downturn has already impacted traders, with some reporting losses after the short-term structure was breached.
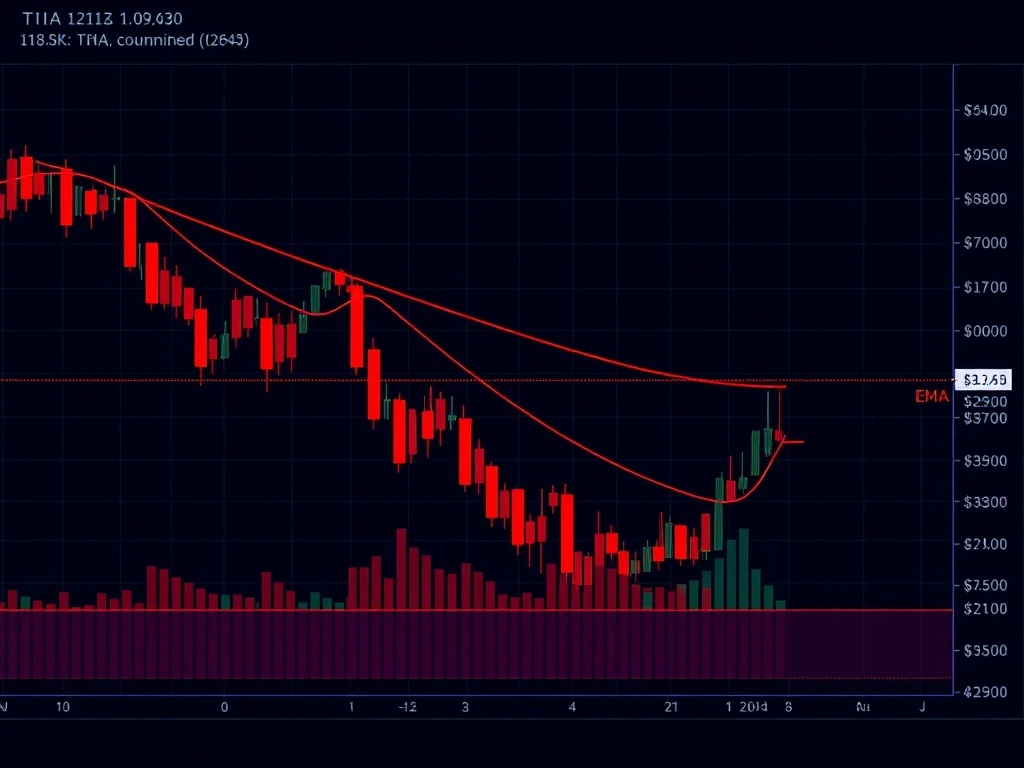
The Critical EMA Breakdown Explained
A crucial element in TIA’s recent price action is the pronounced EMA breakdown. On the 4-hour chart, the TIA token notably slipped beneath both the 50 EMA and 100 EMA, which are often watched by traders for short-to-medium term trend identification. More significantly, the 200 EMA, located at $1.877, was also pierced. The 200 EMA is widely considered a key indicator of long-term trend direction, and a breach often signals a strong bearish sentiment taking hold.
This sequence of EMA breaches reinforces the bearish bias. The 4-hour chart also revealed a critical retest failure of the $1.93–$2.03 resistance cluster, an area previously eyed as potential support. With sellers gaining firm control after these key moving averages were lost, the downward trend has consolidated, opening the door for further downside if current support levels fail to hold.
Navigating Celestia Price Action and Resistance
On the daily timeframe, the rejection of Celestia price from the descending trendline underscored weakening momentum. The asset had shown signs of attempting a breakout in late July, only to be pushed back below this significant diagonal resistance. This marked a key reversal point for the token, leading to a substantial decline of over 10.2% in a single session on July 23 alone.
The price action for the TIA token remains firmly beneath this long-standing descending diagonal. Compounding the bearish sentiment, trading volume has also shown signs of waning, indicating a broader deterioration in market confidence. For any significant recovery, TIA would need to convincingly reclaim and hold above this trendline, a feat that currently appears challenging given the prevailing market dynamics.
Identifying Key Cryptocurrency Support Levels
For traders and investors, identifying robust cryptocurrency support levels is paramount, especially during a downtrend. Currently, the $1.77 mark stands as a critical immediate support for the TIA token. This level is reinforced by visible reaction wicks on both the 4-hour and daily charts, suggesting some buying interest at this price point.
However, if the selling pressure intensifies and TIA breaks below $1.77, prior lows near $1.60 could quickly become relevant as the next potential floor. The proximity of the 200 EMA to the $1.77 level adds further significance, making it a crucial inflection point. On the upside, resistance remains stagnant between $1.93 and $2.03, the very zone where the initial breakdown originated. The market is now keenly watching whether $1.77 can withstand the pressure and prevent a deeper correction.
Expert Crypto Market Analysis: What’s Next for TIA?
A thorough crypto market analysis of TIA’s current technical landscape suggests a continuation of the bearish bias unless a powerful reversal emerges. The breakdown below the consolidation zone that formed between July 13 and July 23 has cleared the path for potential further downside, particularly if the crucial $1.77 support level is breached.
The TIA token is currently in a reactive phase, with its price action tightly clustered just below previous support levels that have now flipped into resistance. For a bullish turnaround, TIA would need to demonstrate strong buying volume and reclaim key EMAs, along with the $1.93-$2.03 resistance cluster. Until then, caution remains the watchword for traders navigating the Celestia market.
Conclusion
The recent 8.9% slide in the TIA token price underscores the volatile nature of the crypto market, driven by a clear resistance rejection and a significant EMA breakdown. With critical support at $1.77 now in focus, and resistance firmly established between $1.93 and $2.03, the immediate future for Celestia’s native token appears challenging. Traders and investors should closely monitor these key levels, as their ability to hold or break will dictate the next phase of TIA’s price action. A strong reversal is needed to alleviate bearish fears, but for now, the path of least resistance appears to be downwards.
Frequently Asked Questions (FAQs)
Q1: What caused the recent 8.9% decline in the TIA token price?
The recent decline was primarily triggered by a rejection from a long-term descending trendline and a failure to sustain above the $2.03 resistance zone. This led to a breakdown below key Exponential Moving Averages (EMAs), intensifying selling pressure.
Q2: What are EMAs, and why is their breakdown significant for TIA?
EMAs (Exponential Moving Averages) are technical indicators that show the average price of an asset over a period, with more weight given to recent prices. TIA’s breakdown below the 50, 100, and especially the 200 EMA signals a strong shift to a bearish trend, indicating that selling pressure is dominating and the short-to-long term outlook is weakening.
Q3: What are the critical support levels for TIA token that traders should watch?
The immediate critical support level for the TIA token is $1.77. If this level fails to hold, the price could potentially drop further towards prior lows near $1.60. These levels are crucial for preventing a deeper correction.
Q4: Where does the TIA token face strong resistance?
The primary resistance zone for the TIA token is currently between $1.93 and $2.03. This is the same cluster from which the recent breakdown originated, and a sustained move above this area would be necessary to signal a potential reversal in the bearish trend.
Q5: Does this price action indicate a long-term bearish trend for Celestia?
While the immediate technical landscape suggests a continuation of bearish bias, the long-term outlook depends on TIA’s ability to reclaim key resistance levels and break above the descending trendline that has been in place since January 2024. Until then, the bearish sentiment is likely to persist in the short to medium term.


