FLOKI’s **Astonishing** Recovery: Bouncing from Key Fibonacci Level, Analysts Eye $0.00022 Target
In the dynamic world of cryptocurrencies, discerning strong recovery signals is key for investors. Recently, FLOKI, the popular meme coin, has captured significant attention with a remarkable bounce from a crucial technical indicator. This FLOKI price action suggests a potential bullish continuation, exciting many in the crypto community.
Understanding FLOKI’s Remarkable Bounce from the 0.618 Fibonacci Level
After a period of correction, FLOKI has displayed robust signs of recovery, specifically by stabilizing above the significant 0.618 Fibonacci level. For those new to technical analysis, the Fibonacci retracement levels are horizontal lines that indicate where support and resistance are likely to occur. The 0.618 level is particularly potent, often acting as a strong rebound point during market pullbacks.
- Key Support Zone: FLOKI’s price touched a low of approximately $0.0001291 before decisively rebounding, underscoring the 0.618 level’s role as a critical support zone.
- Bullish Structure Confirmed: The stabilization above $0.00013 in mid-June, coupled with an ascending trendline support and a series of higher lows, reinforces a strong bullish structure for FLOKI.
- Correction Concluded: This recent price action suggests that the previous correction phase has concluded, setting the stage for FLOKI to potentially embark on a new upward trend, driven by Fibonacci extension levels.
What Does This Crypto Recovery Mean for FLOKI’s Future?
The bounce from the 0.618 Fibonacci level is a strong indicator of a potential crypto recovery for FLOKI. Technical analysts are now focusing on Fibonacci extension levels to project future price movements. The 1.618 Fibonacci extension is currently a primary point of interest, leading to an ambitious yet achievable target.
This technical setup suggests that if the upward momentum persists, FLOKI could see significant gains. The resilience demonstrated against recent consolidation pressures, with the price stabilizing above $0.0001303, further bolsters this optimistic outlook. While past performance is not indicative of future results, the current chart patterns offer a compelling narrative for potential growth.
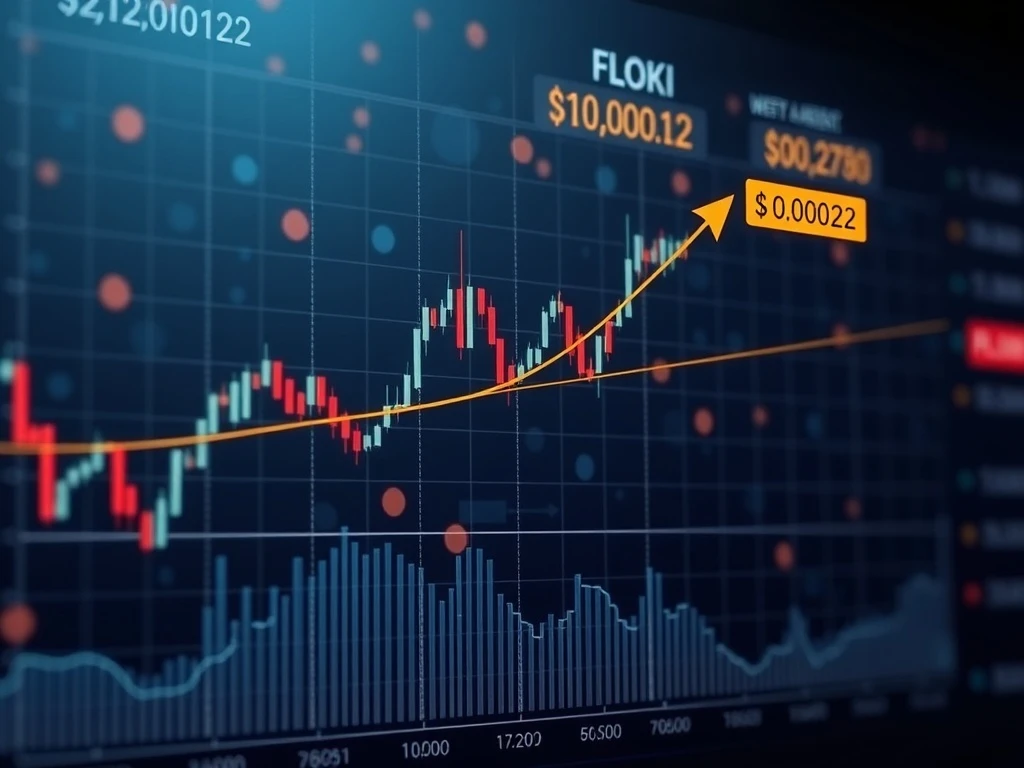
Analysts Pinpoint the Next FLOKI Price Target: $0.00022
The buzz around FLOKI isn’t just about its recent bounce; it’s also about where it’s headed next. Based on the 1.618 Fibonacci extension, analysts have identified $0.00022 as the next significant FLOKI price target. This target represents a substantial upside from current levels, drawing considerable attention from traders and investors alike.
One prominent market observer, Crypto Peer, has even suggested that FLOKI “still has at least 10x potential left in this cycle.” While such bold predictions come with inherent risks, they align with the strong technical indicators currently in play. Achieving this target will, however, depend on sustained buying pressure and FLOKI maintaining its strength above critical support levels.
Diving Deeper into FLOKI’s Technical Analysis and Market Metrics
A comprehensive technical analysis of FLOKI reveals several key factors supporting the bullish narrative:
- Market Capitalization: FLOKI currently boasts a market capitalization of $1.24 billion, positioning it at 73rd among cryptocurrencies on CoinMarketCap.
- Supply Dynamics: With a circulating supply of 9.54 trillion tokens out of a total supply of 9.65 trillion, the fully diluted valuation stands at approximately $1.25 billion. These figures indicate a well-distributed asset with a significant market presence.
- Volume Trends: Despite a 33.47% decline in 24-hour trading volume to $142.9 million, the volume-to-market cap ratio of 11.64% suggests continued investor engagement and liquidity. The early trading hours on July 26 saw increased buying pressure, enabling FLOKI to reclaim the $0.000132 level before consolidating, further validating the underlying strength.
- Ascending Trendline Support: The ascending trendline established in mid-June continues to provide robust support, with higher lows consistently appearing on the chart, confirming the recovery phase.
These metrics, combined with the successful bounce from the 0.618 Fibonacci level, paint a favorable picture for FLOKI’s near-term trajectory.
What Should FLOKI Traders Watch For?
While the outlook appears promising, market participants are always advised to remain vigilant. For FLOKI, maintaining momentum above key support levels will be paramount. Traders should closely monitor:
- Volume Trends: A sustained increase in trading volume accompanying price appreciation would signal strong conviction from buyers. Conversely, declining volume during upward moves could indicate weakness.
- Trendline Support: The ascending trendline established in mid-June serves as a crucial line of defense. Any break below this trendline could signal a shift in momentum.
- Key Resistance Levels: Beyond the $0.00022 target, traders should identify subsequent Fibonacci extension levels as potential resistance points where profit-taking might occur.
The recovery trajectory and Fibonacci-based analysis indicate a strategic focus on these technical levels for FLOKI traders. Sustained buying activity and structural integrity in the chart will be critical for confirming the bullish scenario.
Conclusion: FLOKI’s Path Forward
FLOKI’s impressive bounce from the 0.618 Fibonacci retracement level has ignited optimism across the crypto market. With analysts eyeing a potential move towards the $0.00022 target, the meme coin demonstrates a strong technical foundation for continued growth. While market volatility remains a constant, the current indicators suggest that FLOKI is well-positioned for an exciting period ahead. As always, diligent research and risk management are crucial for any investment decisions in the fast-paced world of digital assets.
Frequently Asked Questions (FAQs)
Q1: What is the 0.618 Fibonacci retracement level, and why is it important for FLOKI?
The 0.618 Fibonacci retracement level is a key technical indicator derived from the Fibonacci sequence. It’s considered a significant support or resistance level where an asset’s price often reverses its trend after a correction. For FLOKI, its bounce from this level suggests that a strong buying interest emerged, potentially signaling the end of a downtrend and the beginning of an upward movement.
Q2: What is the significance of the $0.00022 FLOKI price target?
The $0.00022 price target for FLOKI is identified using the 1.618 Fibonacci extension level. This level is projected based on FLOKI’s previous price movements and the recent bounce. It represents a potential future resistance point or profit-taking target if the current bullish momentum continues, indicating a substantial upside from its current position.
Q3: How do market capitalization and trading volume affect FLOKI’s outlook?
Market capitalization reflects FLOKI’s overall market value and its standing among other cryptocurrencies. A higher market cap indicates greater investor confidence and liquidity. While a recent decline in trading volume was noted, the healthy volume-to-market cap ratio suggests ongoing investor participation. Sustained high trading volume during price increases is generally a bullish sign, indicating strong buying pressure.
Q4: What is “technical analysis” in the context of cryptocurrency, and how is it applied to FLOKI?
Technical analysis involves studying past market data, primarily price and volume charts, to forecast future price movements. For FLOKI, it involves identifying patterns like ascending trendlines, higher lows, and applying tools like Fibonacci retracements and extensions. This helps analysts predict potential support and resistance levels, and identify price targets, offering insights into FLOKI’s likely trajectory.
Q5: What are the key factors to monitor for FLOKI’s continued recovery?
For FLOKI’s recovery to sustain, traders should monitor several key factors: consistent buying pressure, maintenance of the ascending trendline support, and a healthy increase in trading volume accompanying price appreciation. Any significant break below established support levels or a sustained drop in volume could signal a shift in momentum.


