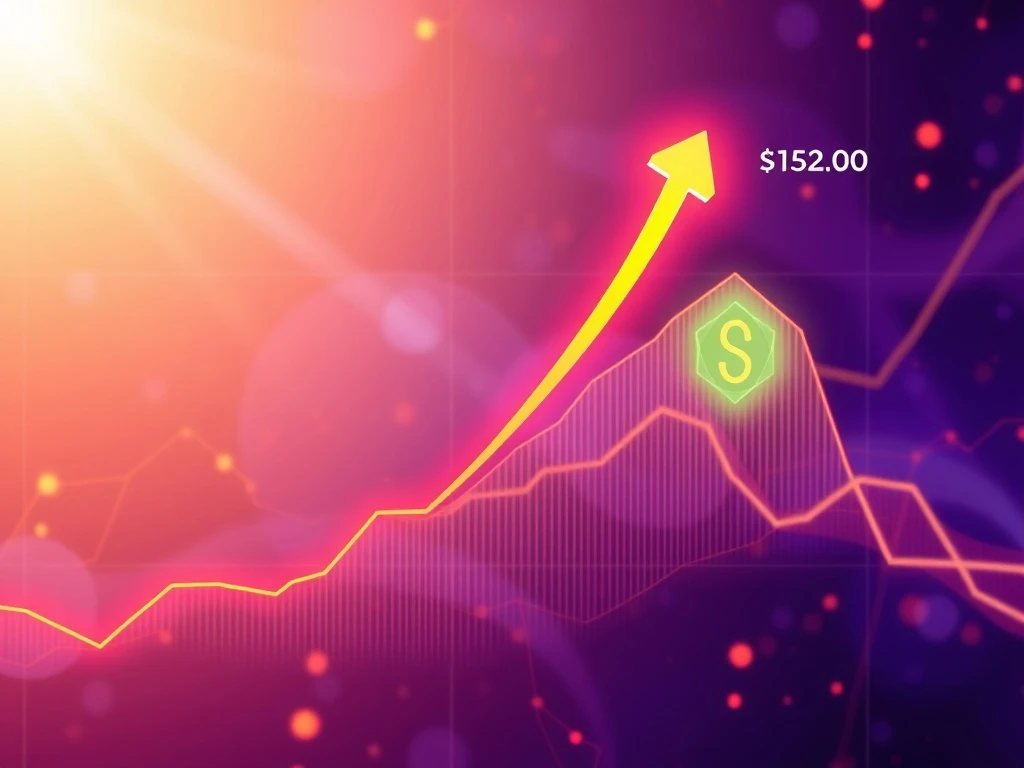
Solana Price Prediction: Unlocking the Astonishing $6,000+ Rally Potential
The cryptocurrency market is buzzing, and all eyes are on Solana (SOL) as it paints a ‘textbook’ chart pattern hinting at an astonishing rally. Could the sixth-largest cryptocurrency be on the cusp of a monumental surge, potentially reaching figures that seem almost unbelievable? Recent movements suggest a significant shift, prompting many to revisit their Solana price prediction models. This deep dive explores the technical indicators and fundamental strengths positioning SOL for what could be an unprecedented climb.
Solana Price Prediction: Decoding the Bullish Chart
Solana has been on an impressive run, with its price climbing 34% over the past month alone, reaching a five-month high of $193. This momentum has analysts scrutinizing charts for clues about its next move. The most compelling signal emerging from this analysis is the formation of a ‘cup-and-handle’ pattern across multiple timeframes – a classic bullish indicator in technical analysis. This pattern suggests that after a period of consolidation, a significant upward breakout is imminent.
Despite its recent gains, SOL remains 35% below its all-time high of $295. However, this gap is seen not as a weakness but as an opportunity, with several market observers believing Solana is poised to enter price discovery mode. Since establishing a cycle low of around $10 in November 2022, SOL has already surged by over 2,400%, laying the groundwork for this anticipated pattern.
The ‘Cup and Handle’ Pattern Explained: What It Means for SOL Price
For those new to technical charting, the ‘cup and handle’ is a bullish continuation pattern that resembles a teacup. The ‘cup’ is a U-shaped recovery, followed by a ‘handle,’ which is a smaller, downward-sloping consolidation. A breakout above the handle’s resistance line signals a potential strong upward move. In Solana’s case, this pattern is appearing on daily, weekly, and even two-month charts, lending significant weight to the bullish outlook for SOL price.
Crypto investor Robert Mercer highlighted a clear cup-and-handle formation on SOL’s chart, indicating a massive upward trajectory once confirmed. Similarly, ‘Mister Crypto’ described Solana’s weekly chart as a ‘textbook’ example, expressing strong bullish sentiment. Perhaps the most ambitious forecast comes from popular crypto analyst Trader Tardigrade, who identified a four-year cup-and-handle pattern on Solana’s macro two-month chart, targeting an astounding $4,800. He notes that ‘the breakout of the handle is imminent.’
On the monthly chart, the price has already broken above the cup’s handle at $155. The ultimate confirmation of this pattern occurs when the price breaks above its neckline resistance at $250. Should this occur, the theoretical price target is calculated by measuring the maximum distance between the cup’s trough and the neckline, then projecting that distance upward from the breakout point. This calculation places SOL’s cup-and-handle breakout target for 2025–2026 at approximately $6,300, representing a potential increase of over 3,000% from current levels.
It is important to note, however, that while powerful, technical patterns are not guarantees. A study by veteran analyst Thomas Bulkowski found that only about 61% of cup-and-handle setups reach their full upside targets. This highlights the importance of combining technical analysis with other indicators and careful risk management.
Behind the Surge: On-Chain Metrics Fueling the Solana Rally
Beyond the compelling technical charts, Solana’s robust on-chain metrics provide a strong fundamental backing for the anticipated Solana rally. These metrics offer a glimpse into the health and activity of the network, which are crucial for sustainable price growth.
- Daily Active Addresses: User engagement is a key indicator of network vitality. Solana has seen a 9% increase in daily active addresses over the last 24 hours, reflecting growing user interest and participation within its ecosystem.
- Daily Transactions: The number of daily transactions on Solana has resumed its parabolic rise from 2024, according to Nansen data. This surge in transaction volume indicates high utility and adoption, as more users and applications leverage the blockchain for various operations.
- Total Value Locked (TVL): Solana’s TVL, which represents the total value of assets locked in decentralized finance (DeFi) protocols on its blockchain, has soared to a six-month high of $10.3 billion. This marks an impressive increase of over 63% in just 15 weeks, up from $6.1 billion on April 8, according to DefiLlama.
Solana has solidified its position as the second-largest blockchain by TVL, commanding a market dominance of 6.28%. While still behind Ethereum, which holds a dominant 68%, Solana’s rapid growth in TVL signifies increasing confidence and investment in its DeFi ecosystem. This expansion of network activity and locked capital provides a solid foundation for any potential price appreciation.
Navigating the Crypto Market Analysis: Risks and Rewards
While the outlook for Solana appears exceptionally bullish, any form of crypto market analysis must consider the inherent risks. The cryptocurrency market is known for its volatility, and price movements can be swift and unpredictable. Technical patterns, while often reliable, do not guarantee outcomes. Factors such as broader market sentiment, regulatory developments, and unforeseen network issues can all impact price trajectory.
For investors considering Solana, it is crucial to:
- Conduct Thorough Research (DYOR): Do not rely solely on technical patterns or analyst predictions. Understand Solana’s technology, its use cases, competitive landscape, and long-term vision.
- Understand Risk Tolerance: Only invest what you can afford to lose. The potential for high returns often comes with an equally high risk of loss.
- Diversify Your Portfolio: Spreading investments across various assets can help mitigate risk.
- Stay Informed: Keep abreast of market news, on-chain data, and project developments to make timely and informed decisions.
The potential rewards, if the cup-and-handle pattern plays out, are substantial. However, a balanced approach that acknowledges both the opportunities and the challenges is essential for navigating this dynamic market.
Is a $6,000+ SOL Price Realistic?
The target of $6,000 to $6,300 for SOL price seems ambitious, especially given its current valuation. However, when considering the confluence of strong technical indicators and robust on-chain fundamentals, it becomes a scenario worth serious consideration. The multi-year cup-and-handle pattern, supported by growing network activity, increased user engagement, and soaring TVL, paints a picture of a blockchain gaining significant traction and adoption.
Historical bull runs in the crypto space have shown that assets with strong fundamentals and compelling technical setups can achieve exponential growth that defies conventional expectations. While the 61% success rate of the cup-and-handle pattern suggests that the full target isn’t guaranteed, the sheer scale of the pattern and the underlying network strength indicate a significant upside potential for Solana in the coming years.
Solana stands at a pivotal moment, with its price action reflecting a ‘textbook’ bullish pattern that, if confirmed, could lead to an astonishing rally towards the $6,000+ mark. This technical promise is powerfully reinforced by a surge in on-chain activity, including increasing daily active addresses, transaction counts, and a significant rise in Total Value Locked. While the journey to such an ambitious target will undoubtedly involve market volatility and challenges, the combination of strong technical signals and robust fundamental growth positions Solana as a compelling asset to watch. As always, prospective investors should conduct their own thorough research and exercise caution, but the stage appears set for Solana to potentially unlock unprecedented value.


