**BNB Price Prediction**: Alarming 17.1% Drop Looms as ABC Pattern Signals Deep Correction
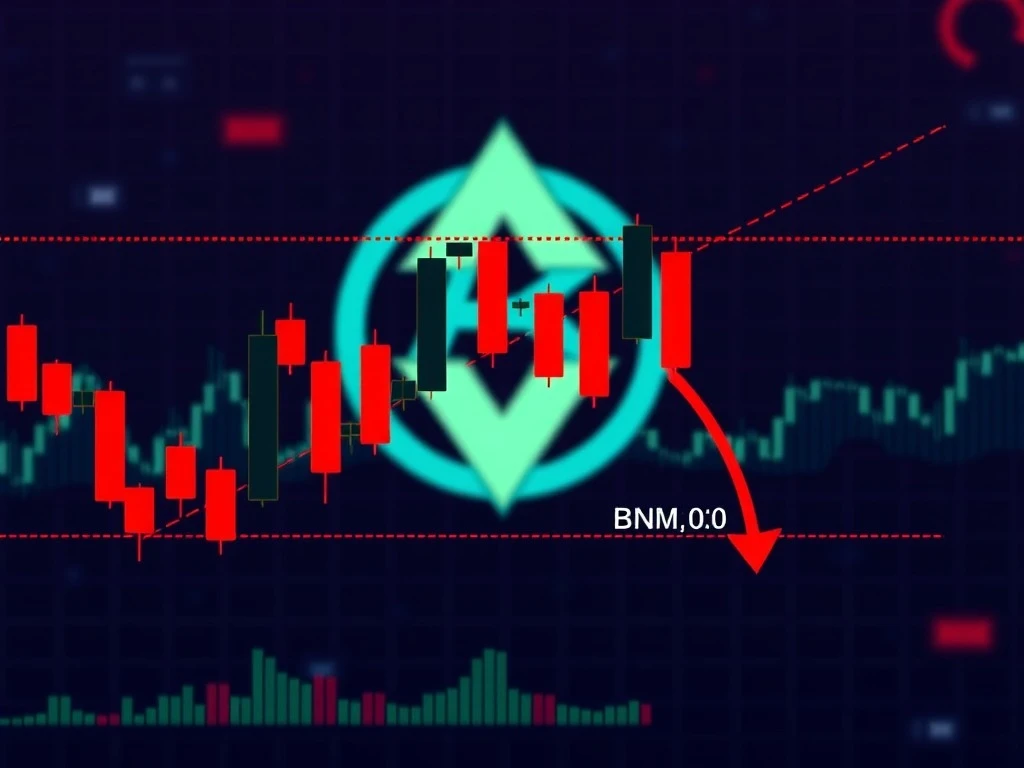
The cryptocurrency market is a dynamic arena, and for BNB holders, recent technical signals suggest a period of significant volatility. A concerning **BNB price prediction** has emerged from leading analysts, indicating a potential 17.1% decline that could see the asset plunge towards $663. Is your portfolio ready for this shift?
Understanding the Looming Correction in **BNB Price Prediction**
BNB, the native cryptocurrency of the Binance ecosystem, appears to be entering a critical corrective phase. Following a robust five-wave bullish advance, technical indicators and chart patterns are now pointing towards a significant pullback. This isn’t just a minor dip; it’s a structured decline that analysts believe could retrace a substantial portion of recent gains.
According to technical analysis shared by analyst BigMike on July 24, 2025, BNB has formed a ‘flat correction’ pattern on the 1-hour chart. This pattern, often seen after strong upward moves, suggests a methodical unwinding of price. From its recent peak near $800, BNB has already shown signs of weakness, currently trading around $780.93, having retraced from a high of $804.85.
Unpacking the Bearish **ABC Pattern** for BNB
At the heart of this bearish outlook is the classic **ABC pattern**, a foundational concept in Elliott Wave Theory. This three-wave corrective structure typically follows a five-wave impulsive move, signaling a reversal of the previous trend. Here’s how it’s unfolding for BNB:
-
Wave (a): The Initial Drop
The correction began with a sharp decline, identified as wave (a), which saw BNB drop to $744.96. This initial leg established a crucial support level.
-
Wave (b): The Partial Rebound
Following wave (a), BNB experienced a partial rebound to approximately $780, forming wave (b). However, this rebound has shown signs of weakness, failing to reclaim significant resistance levels.
-
Wave (c): The Projected Decline
The most critical part of the pattern is the projected wave (c), which is expected to extend the decline. Based on Fibonacci extensions, wave (c) could target $712 (corresponding to the 1.618 Fibonacci extension) and potentially $663 (the 2.618 Fibonacci extension). This $663 target represents a significant 17.1% drop from current levels.
The failure of BNB to hold above the critical $765 resistance level (aligned with the 0.618 Fibonacci retracement) further reinforces the bearish momentum, indicating that buyers are struggling to maintain control.
The Power of **Elliott Wave Theory** in Action
The **Elliott Wave Theory** is a cornerstone of technical analysis, suggesting that market prices move in identifiable patterns driven by investor psychology. In this case, the theory is being applied to forecast BNB’s trajectory. The completed five-wave bullish advance followed by the anticipated ABC correction is a classic Elliott Wave setup. Traders use these patterns to anticipate future price movements and identify key entry and exit points.
The precision of the Fibonacci extension targets ($712 and $663) highlights how Elliott Wave practitioners use mathematical ratios to project potential reversal zones. While not infallible, these targets provide critical benchmarks for traders to monitor.
Navigating a Potential **Crypto Market Correction**
For any asset, especially in the volatile crypto space, a significant correction can be unsettling. However, understanding the underlying technical reasons, like the **ABC pattern** and Fibonacci levels, can help traders and investors make informed decisions. During such phases, it’s common to see:
- Increased Volatility: Prices can swing rapidly as buyers and sellers battle for control.
- Shift in Sentiment: Bearish sentiment can become dominant, leading to panic selling if key support levels break.
- Opportunity for Entry: For long-term investors, corrections can present opportunities to acquire assets at lower prices.
The current scenario for BNB serves as a reminder that even strong assets undergo healthy corrections, and being prepared for them is crucial.
Key Levels and **BNB Technical Analysis** to Watch
Beyond the ABC pattern, several other technical indicators reinforce the bearish outlook for BNB. These tools provide a comprehensive view of market health and momentum:
- Stochastic RSI and RSI: These momentum oscillators, while showing oversold conditions during wave (b), indicate waning upward momentum as they approach the mid-range. This suggests that the buying pressure during the rebound was not sustainable.
- Volume Analysis: The volume accompanying the wave (b) rebound was noticeably lighter compared to the sharp decline of wave (a). Lower volume on rallies often signals a lack of conviction from buyers and a potential shift in control to sellers.
- Ichimoku Cloud and Moving Average Envelopes: These indicators suggest tightening volatility, which frequently precedes a significant directional breakout. In this context, it implies a strong move is imminent, and the prevailing technical signals point downward.
Traders are closely monitoring specific price levels. A sustained move below $765 could accelerate the decline towards $712 and $663. Conversely, a decisive break above the $800 level would invalidate the projected ABC structure, signaling a potential reversal of the bearish outlook.
What’s Next for BNB? Actionable Insights
The next few hourly candles will be crucial in confirming the validity of this **BNB price prediction** and the ABC structure. For traders and investors, this presents a strategic juncture:
- Risk Management: Consider setting stop-loss orders if you hold BNB and are concerned about further downside. Identify your personal risk tolerance.
- Monitor Key Levels: Keep a close eye on the $765 resistance and the projected support targets of $712 and $663. These levels will indicate the strength of the correction.
- Look for Invalidation: A strong, sustained move above $800 would likely invalidate this bearish pattern, suggesting a renewed bullish trend. Be prepared to adjust your strategy if this occurs.
- Patience: During corrective phases, patience is key. Avoid impulsive decisions and wait for clearer signals of either a confirmed breakdown or a bullish reversal.
The outcome hinges on whether the (b) wave proves terminal or extends further, resetting the chart’s interpretation. Until then, the focus remains on whether the correction establishes a firm base or accelerates downward into deeper support zones.
Conclusion
The **BNB price prediction** indicating a potential 17.1% drop to $663 is a significant development for the crypto community. Driven by a clear **ABC pattern** and supported by various **BNB technical analysis** indicators, this forecast highlights the importance of understanding market cycles and corrective phases. While the market remains unpredictable, leveraging tools like **Elliott Wave Theory** can provide valuable insights, helping you navigate the potential **crypto market correction** with greater confidence. Stay informed, stay vigilant, and always conduct your own research.
Frequently Asked Questions (FAQs)
What is an ABC correction pattern in technical analysis?
An ABC correction pattern is a three-wave corrective structure (labeled A, B, and C) that typically follows a five-wave impulsive move in the opposite direction of the main trend. Wave A is the initial decline, Wave B is a partial rebound, and Wave C is the final, often longest, leg of the correction, leading to new lows or significant support levels.
How does Elliott Wave Theory apply to cryptocurrency markets?
Elliott Wave Theory posits that financial markets move in predictable patterns, or ‘waves,’ driven by investor psychology. It applies to cryptocurrency markets by helping analysts identify these repetitive patterns (impulsive and corrective waves) to forecast future price movements and potential turning points, much like it does in traditional markets.
What are Fibonacci retracement levels, and why are they important for BNB?
Fibonacci retracement levels are horizontal lines indicating where support and resistance are likely to occur. They are derived from the Fibonacci sequence and are expressed as percentages (e.g., 0.382, 0.5, 0.618). For BNB, these levels are crucial as they help project potential price targets during a correction, such as the $712 and $663 targets based on Fibonacci extensions.
What should traders do if BNB undergoes a significant correction?
During a significant correction, traders often consider several strategies: reviewing their risk management (e.g., stop-loss orders), monitoring key support levels for potential bounces, looking for signs of pattern invalidation, or even considering short positions if the bearish trend is strong. Long-term investors might view deep corrections as opportunities to accumulate at lower prices.
Is this BNB price prediction guaranteed to happen?
No, technical analysis predictions, including those based on ABC patterns or Elliott Wave Theory, are not guaranteed. They are probabilities based on historical price action and market psychology. Various factors, including fundamental news, broader market sentiment, and unexpected events, can invalidate a technical pattern. Traders should always use such predictions as a guide, not a certainty.
Where can I find more in-depth BNB technical analysis?
You can find more in-depth BNB technical analysis from various sources, including dedicated crypto news platforms, financial analysis websites, trading view charts with community insights, and reports from professional market analysts. Always cross-reference information from multiple reputable sources to form a comprehensive view.


