Dogecoin Plunge: Alarming Signals as DOGE Dips Below $0.24 Amid Market Turmoil

Dogecoin, the beloved meme coin, has once again captured headlines, but not for the reasons its ardent supporters might hope. The Dogecoin price has taken a significant tumble, falling below the critical $0.24 mark. This latest dip comes amidst a flurry of bearish indicators that are sending ripples of concern throughout the crypto community. If you’ve been watching your DOGE holdings, you’re likely feeling the pinch, and understanding the forces at play is crucial.
What’s Driving the Latest Dogecoin Price Drop?
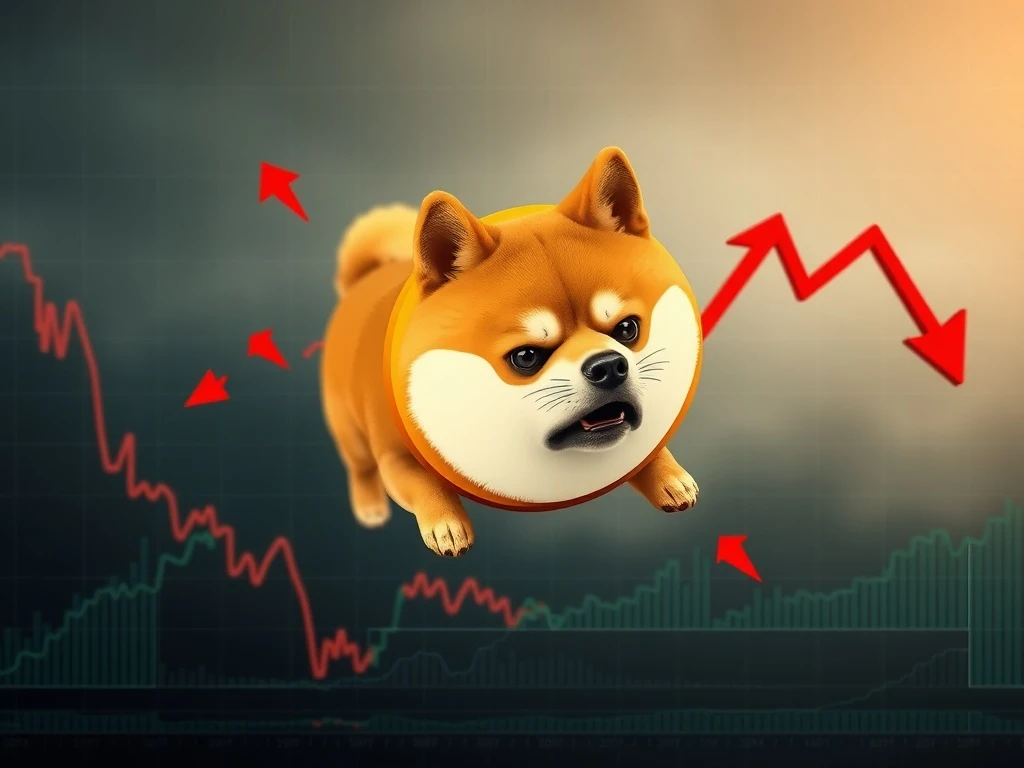
After briefly touching highs near $0.29 earlier in the month, Dogecoin’s price has sharply reversed course. This isn’t just a minor fluctuation; it signals a broader shift in market dynamics. The meme coin has retreated into a descending trend channel, a classic technical pattern indicating downward momentum. Adding to the concern is a ‘bearish engulfing pattern’ observed at the $0.29 resistance level, a strong candlestick formation that often precedes further declines. Currently, DOGE hovers around $0.235, struggling to break free from these bearish constraints. This juncture is particularly critical, as analysts are pointing to sustained bearish momentum across various indicators.
Unpacking Bearish Signals: Technicals and Derivatives
The current bearish signal for Dogecoin is not isolated; it’s a symphony of concerning data points. Derivative market activity, in particular, paints a stark picture of the downward trajectory. We’re seeing a significant drop in derivative open interest coupled with a sharp increase in trading volume. This combination often points to long liquidations, where traders who bet on price increases are forced to sell their positions, accelerating the decline. For instance, open interest plunged by 15.3% while trading volume surged by an astounding 72.5%. This dynamic suggests that selling pressure is dominating the market, with many long positions being unwound.
The Impact of Falling Open Interest and Surging Volume
Let’s dive deeper into the implications of derivative data. The substantial fall in open interest (15.3%) alongside a massive 72.5% surge in trading volume is a potent combination. In simple terms, it means that while new money isn’t flowing into futures contracts (as indicated by falling open interest), there’s a huge amount of activity – specifically, selling activity. This often occurs when leveraged long positions are being liquidated, meaning traders who borrowed money to bet on DOGE’s rise are being forced to close their positions as the price drops, adding more selling pressure to the market. Binance’s long/short ratio for DOGE/USDT accounts further underscores this imbalance, standing at 3.22. Even more telling, top traders’ positioning is skewed at 4.47, indicating a significant overcrowding of long positions. This ‘overcrowded long’ scenario creates a fragile market where even a small cascade of selling can trigger widespread liquidations, exacerbating the downward trend. While options open interest has also seen a general decline (down 40.2%), a recent 17% rise within that segment suggests some renewed hedging or directional betting, perhaps by those anticipating further declines.
What Does This Mean for DOGE News and Future Prospects?
For anyone following DOGE news, these technical and derivatives insights are crucial. The technical indicators are largely confirming the bearish bias. The Directional Movement Index (DMI), a tool used to assess trend strength and direction, shows the negative directional indicator (-DI) at 38.18, significantly higher than the positive directional indicator (+DI) at 11.45. This clearly confirms seller dominance. The Average Directional Index (ADX) at 29.13 further supports the strength of this trend. Adding to the gloom, the Supertrend indicator on the 4-hour chart has flipped bearish, now acting as resistance at $0.27. On shorter timeframes, like the 30-minute chart, the Relative Strength Index (RSI) has rebounded slightly to 46.3 from oversold levels, but it remains below 50, indicating that buyers are not yet in control. The Moving Average Convergence Divergence (MACD) also remains bearish at -0.00287. Furthermore, the Bollinger Bands on the 4-hour timeframe are widening, with the price near the lower band at $0.2322, suggesting increased volatility and potential for further downside. DOGE is currently trading below all major Exponential Moving Averages (EMAs) – the 20, 50, 100, and 200 – reinforcing the strong bearish sentiment across multiple timeframes.
Navigating the Crypto Market Analysis: Key Levels to Watch
For those engaged in crypto market analysis, understanding the immediate price levels is paramount. Short-term predictions hinge on DOGE’s ability to reclaim key support. A sustained 24-hour rebound above $0.2417 could potentially trigger a test of higher resistance levels, such as $0.2515 (the 20 EMA) or $0.2595 (the Bollinger basis). However, if Dogecoin fails to hold above $0.2417 with sufficient buying volume, the price could quickly descend towards $0.2240 or even $0.2060. The Smart Money Concepts analysis further complicates the picture, noting a bearish ‘Change of Character’ (CHoCH) pattern near $0.26, which adds to the existing structural risks. On-chain metrics also offer little comfort; the On-Balance Volume (OBV) shows stagnant accumulation at 47.77B, indicating weak buying interest from larger players. The derivatives market bias remains heavily long-weighted, carrying elevated risks of a ‘squeeze’ – a rapid price drop triggered by mass liquidations of these overcrowded long positions. For the time being, Dogecoin’s trajectory appears to be corrective, rather than a reversal, implying that further downside is possible until a decisive break above the $0.2440–$0.2510 range occurs to negate these pervasive bearish signals.
The recent plunge of Dogecoin price below $0.24 is a stark reminder of the volatile nature of the cryptocurrency market. With a confluence of bearish technical indicators, significant shifts in derivative open interest and trading volume, and a clear imbalance in long positions, DOGE faces considerable headwinds. While the meme coin has shown resilience in the past, the current market structure suggests a period of correction rather than immediate recovery. Investors and traders should remain vigilant, closely monitoring key support and resistance levels, and exercising caution as the bearish signal continues to dominate the narrative for DOGE news. Understanding these intricate details is vital for navigating the unpredictable landscape of crypto market analysis.
Frequently Asked Questions (FAQs)
Q1: Why is Dogecoin’s price falling today?
A1: Dogecoin’s price is falling due to a combination of factors, including a retreat into a descending trend channel, a bearish engulfing pattern at resistance, a significant drop in open interest, and a surge in trading volume, all pointing to strong selling pressure and long liquidations.
Q2: What do falling open interest and surging trading volume mean for DOGE?
A2: When open interest falls while trading volume surges, it often indicates that existing leveraged positions, particularly long ones, are being closed out or liquidated. This creates intense selling pressure, accelerating the price decline as traders are forced to sell.
Q3: What are the key technical indicators suggesting a bearish trend for Dogecoin?
A3: Several technical indicators confirm the bearish trend, including the Directional Movement Index (-DI > +DI), a high ADX, a bearish Supertrend flip, RSI below 50, bearish MACD, widening Bollinger Bands with price near the lower band, and DOGE trading below all major EMAs.
Q4: What are the critical price levels for Dogecoin to watch?
A4: Key levels to watch are $0.2417 for a potential rebound, with resistance at $0.2515 and $0.2595. Failure to hold $0.2417 could lead to further drops towards $0.2240 or $0.2060. A decisive break above $0.2440–$0.2510 is needed to negate bearish signals.
Q5: Is this a temporary correction or a long-term bearish trend for Dogecoin?
A5: Based on current technical and on-chain metrics, the trajectory appears to be corrective rather than a definitive reversal. While a long-term trend isn’t confirmed, the immediate outlook is bearish, and a sustained recovery requires overcoming significant resistance levels and a shift in market sentiment.


