Bullish Bitcoin Price Prediction: OBV & Bull Flag Target $135K Surge
Bitcoin Price Prediction is a hot topic, especially when technical indicators align to suggest significant upside. Despite recent sideways movement, a key volume metric is hinting that substantial gains could be on the horizon, potentially pushing BTC towards the $130,000-$135,000 range as early as this summer.
Understanding the OBV Indicator Signal
The On-Balance Volume (OBV) indicator is a cumulative metric that relates volume to price changes. It adds volume on ‘up’ days (when price closes higher) and subtracts volume on ‘down’ days (when price closes lower). Essentially, a rising OBV suggests that buying pressure is outweighing selling pressure, even if the price isn’t immediately reflecting it.
Currently, Bitcoin (BTC) has been trading within a relatively tight range, primarily between $102,000 and $112,000 since May. However, the OBV indicator for BTC has continued its upward trajectory during this consolidation period. This divergence – price consolidating while OBV rises – is often interpreted as a sign of ‘hidden’ accumulation, meaning buyers are quietly entering positions without causing a massive immediate price surge.
Historical Precedent for OBV Divergence
Looking back at Bitcoin’s price history, similar OBV divergences have previously foreshadowed strong upward movements. A notable example occurred between March and April 2025. During this time, BTC was consolidating between $76,000 and $84,000, while the OBV began forming higher lows, signaling underlying demand.
What followed this period of accumulation confirmed the OBV’s signal: a significant 57% rally that propelled Bitcoin past $110,000 by May. This historical fractal provides a strong case for the current setup, reinforcing the idea that the rising OBV could be a precursor to another substantial price increase.
The Bull Flag Pattern Supporting the BTC Price Target
Adding further weight to the bullish outlook is the apparent formation of a classic technical pattern: the bull flag. This pattern typically appears after a sharp price increase (the ‘flagpole’), followed by a period of consolidation within a downward-sloping parallel channel (the ‘flag’).
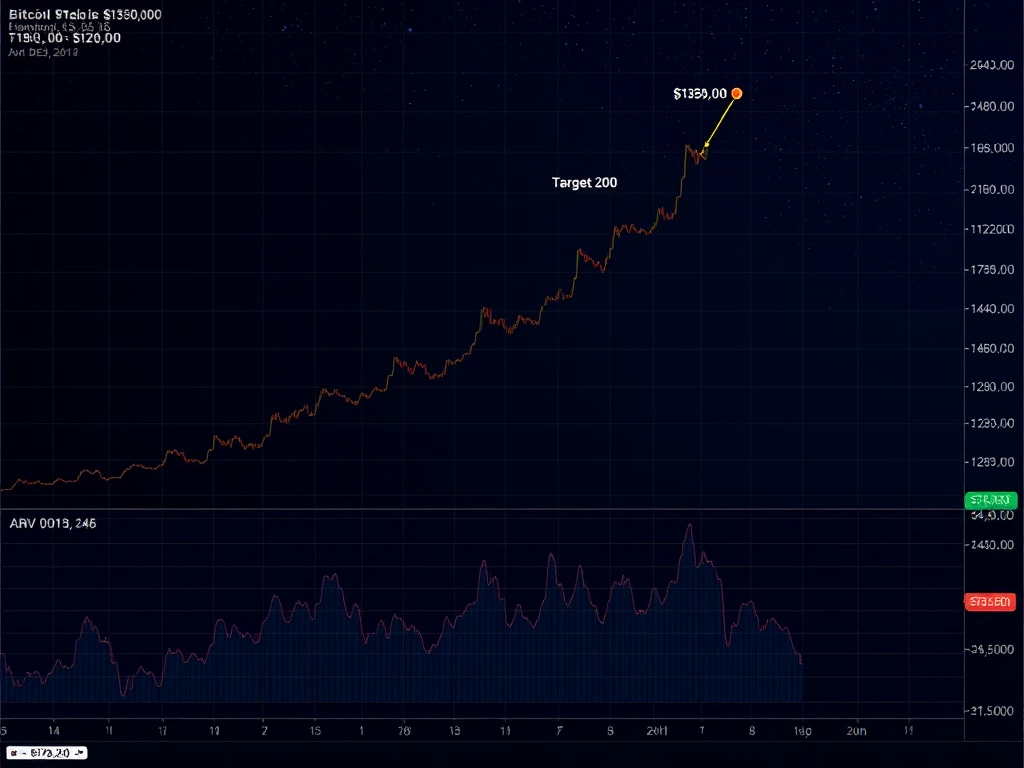
On the daily chart, Bitcoin’s rapid ascent to nearly $112,000 in May from around $93,670 can be seen as the flagpole. The subsequent sideways-to-slightly-downward consolidation forms the flag. A confirmed breakout above the upper trendline of this flag pattern would technically project a price target derived from the height of the flagpole. This measured move target aligns remarkably close to the $130,000-$135,000 range.
Market analyst Cas Abbé is among those highlighting this convergence of signals, suggesting the rising OBV will help drive BTC’s price towards the $130,000–$135,000 area. This target also resonates with predictions from other prominent figures in the space, including Galaxy Digital founder Mike Novogratz, who anticipates Bitcoin reaching $130,000-$150,000 due to factors like institutional inflows.
Why This Crypto Market Analysis Matters
For investors and traders, this convergence of signals from the OBV Indicator and the Bull Flag Pattern provides a compelling narrative for potential upside. While no technical analysis is foolproof, the combination of underlying accumulation suggested by volume and a clear continuation pattern on the price chart presents a strong case for the $130,000-$135,000 BTC Price Target in the near future, potentially within Q3 2025.
It’s crucial to remember that market analysis involves risk, and conducting personal research is always recommended before making investment decisions. However, the current technical landscape for Bitcoin paints an optimistic picture, with key indicators pointing towards a significant price move ahead.
Summary
Bitcoin’s recent price consolidation masks underlying strength, as indicated by a steadily rising OBV. This suggests accumulation is happening behind the scenes. Coupled with a developing bull flag pattern, these technical signals point towards a potential breakout. Historical OBV divergences have led to substantial rallies, and the current setup suggests a move towards the $130,000-$135,000 range is a distinct possibility in the coming months, supported by the Bull Flag Pattern’s target and broader positive sentiment in Crypto Market Analysis.


