Urgent Alert: Why XRP Price Plunged Today and What’s Next?
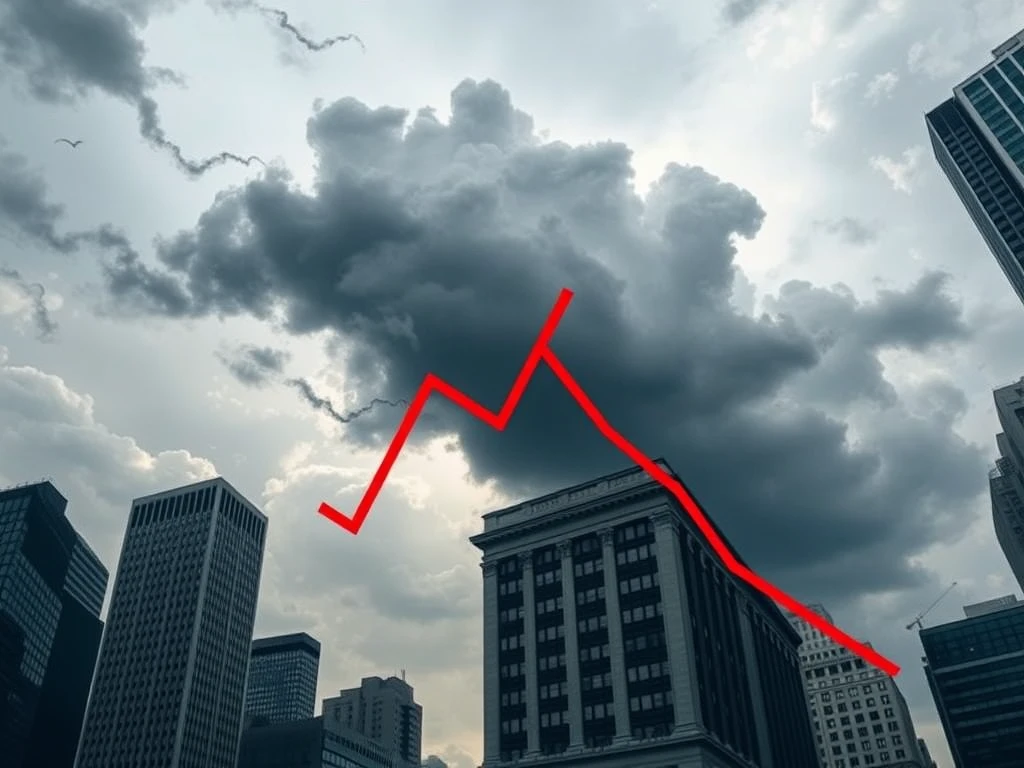
Cryptocurrency markets are experiencing a sea of red, and XRP is no exception. Today, the XRP price has taken a significant hit, dropping by 7.50%. Investors are asking: Why is the XRP price down today? This article dives deep into the factors driving this downturn, from macroeconomic anxieties to specific crypto market events, and what it means for XRP’s future. Is this a temporary dip or the start of a deeper correction? Let’s explore the critical support levels and potential recovery paths for XRP.
Decoding the XRP Price Drop: US Recession Fears Take Center Stage
The primary driver behind the current crypto market crash, and consequently the XRP price decline, is escalating concern about a potential US economic recession. These fears are casting a shadow over all financial markets, and cryptocurrencies, including XRP, are feeling the pressure. Let’s break down the key elements contributing to these recession anxieties:
- JPMorgan’s Recession Warning: JPMorgan Chase has significantly increased its forecast for a US recession, now placing the probability at 40%, up from 30% at the beginning of 2025. This sharp upward revision is a major red flag for investors.
- Trump Administration’s Policies: The current administration’s trade policies, particularly tariffs on imports from key trading partners like Mexico, Canada, and China, are fueling fears of a global trade war. This protectionist approach is seen as detrimental to economic growth.
- President Trump’s Recession Acknowledgment: Adding fuel to the fire, President Trump himself has acknowledged the possibility of a recession during a “period of transition.” This admission, while perhaps intended to be realistic, has further unsettled market participants.
- Goldman Sachs’ Concerns: Echoing JPMorgan, Goldman Sachs has also increased its 12-month recession probability to 20%, up from 15%. They warn that this forecast could worsen if current policies remain in place.
These macroeconomic headwinds are reflected in traditional markets. The Nasdaq E-Mini Futures have plummeted nearly 6% in the past week, and the 10-year Treasury note yields have also seen a significant drop. Simultaneously, the US dollar index is weakening, while currencies like the Euro and Japanese Yen are strengthening. This pattern signals a classic “flight to safety,” where investors are moving away from perceived risk assets, like cryptocurrencies and tech stocks, and towards safer havens amidst economic uncertainty. The overall crypto market capitalization has also decreased by 8.85% during this period, confirming the broad market downturn.
White House Crypto Summit: A Letdown for XRP Bulls?
Adding to the negative sentiment, the White House’s recent Crypto Summit on March 7th appears to have dampened enthusiasm for XRP. Hopes were high that XRP might be considered for inclusion in a US strategic crypto reserve. However, these hopes were quickly dashed. Here’s what transpired:
- Illustrative Examples, Not Official Picks: The Trump administration clarified that while Ethereum, Solana, Cardano, and XRP were mentioned at the summit, they were used merely as examples. They were not official selections for a US crypto reserve. This clarification significantly reduced optimism surrounding XRP’s potential institutional adoption by the US government.
- Bitcoin Remains King: The summit reinforced Bitcoin’s position as the dominant cryptocurrency in the eyes of the US government. The US government already holds a substantial $17.7 billion in BTC, highlighting its established preference for Bitcoin.
- XRP’s Exclusion from US Reserves: The summit suggested that the US crypto strategy might favor altcoin reserves in general, but importantly, it excludes new purchases. This limitation significantly diminishes XRP’s prospects for large-scale institutional accumulation by the US government. Furthermore, there is no evidence to suggest that the US government currently holds any XRP.
This news has negatively impacted the XRP/BTC pair, which has declined by 15% in the last two weeks. Technically, XRP/BTC is consolidating within a historical distribution zone, and a break below a key moving average could signal further weakness.
Technical Analysis: XRP Faces Potential 45% Crash?
Beyond macroeconomic factors and summit disappointments, technical analysis reveals a potentially bearish pattern for XRP. The current XRP price prediction needs to consider the formation of a head-and-shoulders (H&S) pattern on XRP’s price charts.
Understanding the Head-and-Shoulders Pattern:
The H&S pattern is a classic bearish reversal pattern in technical analysis. It forms when the price creates three successive peaks. The middle peak (the “head”) is the highest, and the two peaks on either side (the “shoulders”) are lower and roughly equal in height. A crucial element of this pattern is the “neckline,” which is a support level connecting the lows between the peaks.
XRP’s H&S Pattern and Potential Target:
- As of March 10th, XRP appears to have completed the right shoulder of a potential H&S pattern.
- The price is currently moving towards the neckline support, located around $2.00.
- A decisive break below this neckline could trigger the H&S pattern to resolve.
- The downside target for an H&S pattern is typically calculated by measuring the vertical distance between the head and the neckline and projecting that distance downwards from the neckline breakdown point.
- In XRP’s case, this technical analysis suggests a potential price target of $1.11, representing a potential crypto market crash of over 45% from current levels.
Can XRP Defy the Bearish Momentum? Key Support Levels to Watch
Despite the bearish indicators, there is still hope for XRP bulls. The $2.00 neckline support is not just a standalone level; it converges with two other significant support levels:
- Symmetrical Triangle Lower Trendline: XRP has been trading within a symmetrical triangle pattern, and the lower trendline of this pattern coincides with the $2.00 level.
- 50-3D EMA: The 50-period Exponential Moving Average on the 3-day chart (50-3D EMA) also aligns with the $2.00 support zone.
This confluence of support levels at $2.00 makes it a crucial point for XRP. A strong rebound from this level could delay or even invalidate the bearish H&S pattern.
Potential Bullish Scenario:
If XRP can successfully bounce off the $2.00 support and then decisively break above the upper trendline of the symmetrical triangle (around $2.05 apex point), it could trigger a bullish breakout. The upside target for such a breakout, based on the triangle’s maximum height, would be approximately $3.44.
Conclusion: XRP’s Price at a Crossroads
The XRP price is currently navigating a complex landscape. US recession fears are weighing heavily on the entire altcoin market, and disappointment from the White House Crypto Summit has added to the selling pressure. Technical analysis further points to a potential bearish breakdown. However, the $2.00 support level represents a critical defense for XRP bulls. Whether XRP can hold this level and mount a recovery, or succumb to the bearish forces and potentially experience a deeper correction, remains to be seen. Investors should closely monitor price action around $2.00 and stay informed about macroeconomic developments to make informed decisions in this volatile market. Remember, cryptocurrency investments carry significant risk, and conducting thorough research is paramount before making any trading decisions.