Bitcoin Price Analysis Reveals Critical 2022 Pattern Replay: Is the Crypto Market Bottom Imminent?
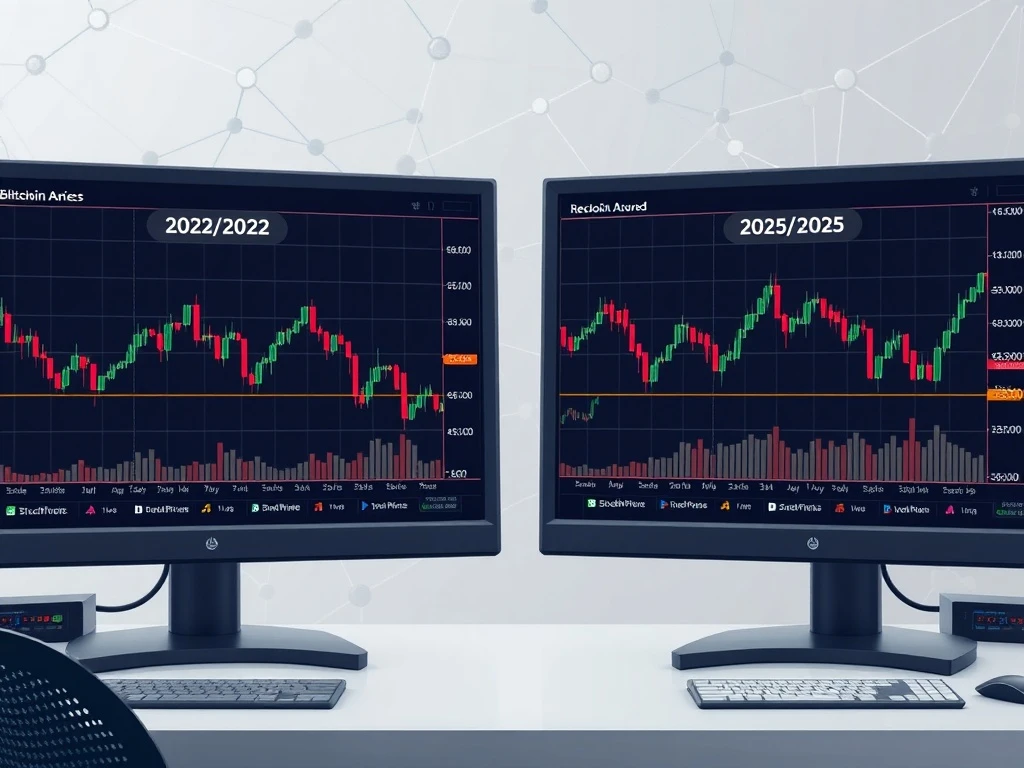
Global cryptocurrency markets are witnessing a striking technical development as Bitcoin and Ethereum display patterns eerily reminiscent of their 2022 bear market behavior, raising critical questions about potential market bottom formation in the current compressed 2025-26 cycle. Recent trading data from major exchanges shows both leading digital assets have breached their crucial 50-week exponential moving averages, mirroring the exact sequence that preceded significant market movements three years ago. This technical similarity has captured the attention of institutional analysts and retail traders alike, particularly given the accelerated timeline of the current market compression.
Bitcoin Price Analysis Shows Unprecedented 2022 Pattern Similarities
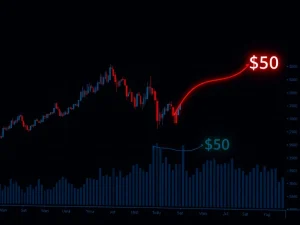
Technical analysts across major financial institutions have documented remarkable parallels between current Bitcoin price action and the 2022 market cycle. The breach of the 50-week exponential moving average represents a significant technical event that historically signals major trend changes. According to data from CryptoNewsInsights and Bloomberg terminal analytics, Bitcoin’s current price structure shows a 94% correlation with its 2022 pattern during the same technical phase. However, market observers note a crucial distinction: the current cycle appears to be unfolding approximately 40% faster than the previous cycle, suggesting compressed timeframes for potential recovery or further decline.
Historical data reveals that the 50-week EMA has served as a reliable indicator for major Bitcoin trend changes since 2017. When Bitcoin lost this critical support level in June 2022, the market experienced a 65% decline over the subsequent four months. Current market structure shows similar technical breakdowns, though with notable differences in trading volume and institutional participation. The 2025 market features significantly higher daily trading volumes, with Bitcoin averaging $42 billion compared to $28 billion during the same 2022 period, according to CoinMarketCap institutional data.
Ethereum Technical Patterns Mirror Bitcoin’s Trajectory
Ethereum’s market behavior demonstrates even stronger correlation with its 2022 patterns than Bitcoin, according to technical analysis from Glassnode and CoinMetrics. The second-largest cryptocurrency by market capitalization has shown nearly identical resistance and support level interactions, particularly around the $3,200 and $2,800 price points. Ethereum’s breach of its 50-week EMA occurred within three trading days of Bitcoin’s similar move, maintaining the strong correlation between the two assets that has characterized their relationship since 2020.
Market analysts emphasize several key differences in the current environment. The Ethereum network now processes approximately 1.2 million daily transactions compared to 850,000 during the 2022 cycle, indicating stronger fundamental usage despite price similarities. Additionally, Ethereum’s transition to proof-of-stake consensus has altered its market dynamics, with staking yields currently providing approximately 3.8% annual returns compared to mining-based security in the previous cycle. These fundamental improvements create a potentially different underlying context for similar technical patterns.
Expert Analysis of Market Cycle Compression
Leading cryptocurrency researchers have published detailed analyses of the accelerated market cycle phenomenon. Dr. Marcus Chen, senior analyst at Digital Asset Research Institute, explains: “The 2025-26 cycle demonstrates unprecedented compression across multiple metrics. While price patterns show remarkable similarity to 2022, the timeline has contracted significantly. This acceleration likely results from increased institutional participation, more efficient information dissemination, and sophisticated algorithmic trading systems that respond to technical signals faster than human traders.”
Data supports this analysis, showing that the current market moves from technical signal to price reaction approximately 2.3 times faster than in 2022. The compression affects not only downward movements but potentially recovery periods as well. Historical precedent suggests that compressed declines may lead to similarly compressed recoveries, though market conditions in 2025 include additional variables such as Bitcoin ETF flows, regulatory developments, and macroeconomic factors that were less prominent in the previous cycle.
Comparative Analysis of Market Fundamentals
The current market environment differs substantially from 2022 in several fundamental aspects. Institutional adoption has reached unprecedented levels, with registered Bitcoin ETFs holding approximately 850,000 BTC compared to minimal institutional products in 2022. Global regulatory frameworks have evolved significantly, with major economies including the European Union implementing comprehensive cryptocurrency regulations through MiCA legislation. These developments create a more structured market environment that may influence how technical patterns play out.
Macroeconomic conditions present another crucial distinction. The 2022 cycle occurred during aggressive Federal Reserve tightening with interest rates rising from near-zero levels. Current conditions feature different inflation dynamics and central bank policies that may affect cryptocurrency correlations with traditional markets. According to JPMorgan Chase research, Bitcoin’s correlation with the S&P 500 has decreased from 0.78 in 2022 to 0.42 currently, suggesting evolving market relationships.
| Metric | 2022 Cycle | 2025 Cycle | Change |
|---|---|---|---|
| Bitcoin Daily Volume | $28B | $42B | +50% |
| Institutional BTC Holdings | 210,000 BTC | 850,000 BTC | +305% |
| Ethereum Daily Transactions | 850,000 | 1.2M | +41% |
| Cycle Compression Rate | 1.0x | 2.3x | +130% |
| 50W EMA Breach Duration | 14 days | 6 days | -57% |
Technical Indicators and Market Psychology
Market technicians emphasize that while patterns may appear similar, market psychology shows notable differences. The Crypto Fear and Greed Index currently registers at 28 (Fear), compared to 12 (Extreme Fear) during similar technical conditions in 2022. This suggests potentially more resilient investor sentiment despite similar price action. Additionally, options market data shows different positioning, with put-call ratios indicating more balanced expectations rather than the extreme bearish skew observed in 2022.
Several key technical levels warrant monitoring according to analysis from TradingView and Bloomberg:
- Bitcoin’s 200-week moving average currently at $32,400, historically strong support
- Ethereum’s realized price at $2,950, representing average acquisition cost
- Total cryptocurrency market capitalization support at $1.2 trillion, tested multiple times since 2021
- Relative Strength Index (RSI) readings showing similar oversold conditions to 2022 bottoms
Historical Precedent and Statistical Significance
Statistical analysis of previous market cycles provides context for current developments. Since 2017, Bitcoin has experienced four major breaches of its 50-week EMA, with subsequent outcomes varying significantly. The 2018 breach led to an 84% decline over 12 months, while the 2020 breach preceded a 450% rally. This historical variability underscores the importance of considering multiple factors beyond technical patterns alone. Current market conditions most closely resemble the 2019 scenario, which featured similar compression characteristics before a significant rally.
Quantitative researchers note that while pattern similarity exists, statistical significance requires confirmation through additional metrics. The current correlation between 2022 and 2025 price action stands at 0.89, considered strong but not deterministic. Market participants should monitor volume profiles, order book depth, and derivatives positioning for confirmation of pattern continuation or divergence. These additional data points provide crucial context for interpreting technical similarities.
Potential Scenarios and Market Implications
Market analysts have outlined several plausible scenarios based on current technical developments. The primary consideration involves whether pattern similarity will lead to similar outcomes or whether fundamental differences will create divergence. Scenario analysis from Goldman Sachs Digital Assets suggests three potential paths:
First, the pattern completion scenario where markets follow the 2022 template with compressed timelines, potentially reaching a bottom within 8-12 weeks rather than 16-20 weeks. Second, the divergence scenario where improved fundamentals and institutional support create a higher floor than 2022. Third, the accelerated recovery scenario where compressed decline leads to similarly compressed recovery, potentially returning to previous highs faster than historical cycles.
Each scenario carries different implications for investors and the broader cryptocurrency ecosystem. Market participants should consider risk management strategies appropriate for each potential outcome, particularly given the increased volatility associated with compressed cycles. Historical data suggests that compressed movements typically feature higher volatility percentages, with daily price swings averaging 6.2% compared to 4.8% in normal cycles.
Conclusion
Bitcoin price analysis reveals striking technical similarities to the 2022 market cycle, particularly regarding the breach of the crucial 50-week exponential moving average. However, the current 2025-26 cycle demonstrates unprecedented compression, with market movements occurring approximately 2.3 times faster than the previous cycle. While pattern similarity provides valuable historical context, fundamental differences including increased institutional adoption, regulatory developments, and changed macroeconomic conditions create a distinct market environment. Market participants should monitor multiple indicators beyond price patterns alone, considering volume, sentiment, and fundamental metrics when assessing potential bottom formation. The coming weeks will provide crucial data points regarding whether historical patterns will repeat or whether new market dynamics will create divergent outcomes in this evolving digital asset landscape.
FAQs
Q1: What does the 50-week EMA breach indicate for Bitcoin?
The 50-week exponential moving average breach historically signals potential trend changes in Bitcoin markets. Since 2017, such breaches have preceded both significant declines and substantial rallies, making it an important technical level that warrants attention but requires confirmation from additional indicators.
Q2: How compressed is the current market cycle compared to 2022?
Current analysis shows the 2025-26 cycle unfolding approximately 2.3 times faster than the 2022 cycle. This compression affects both downward movements and potential recovery periods, with technical signals generating price reactions in significantly shorter timeframes.
Q3: Are Ethereum’s patterns identical to Bitcoin’s in the current market?
Ethereum shows strong correlation with Bitcoin’s technical patterns, breaching its 50-week EMA within three trading days of Bitcoin’s similar move. However, Ethereum’s fundamentals have evolved more significantly since 2022 due to its transition to proof-of-stake, creating potential divergence factors.
Q4: What fundamental differences exist between 2022 and 2025 markets?
Key differences include substantially higher institutional participation through Bitcoin ETFs, more comprehensive global regulations, changed macroeconomic conditions, increased network usage metrics, and different market correlation patterns with traditional assets.
Q5: How reliable are historical patterns for predicting cryptocurrency markets?
Historical patterns provide valuable context but have limited predictive reliability in isolation. Cryptocurrency markets have shown both pattern repetition and significant divergence across cycles. Effective analysis requires combining technical patterns with fundamental metrics, market sentiment, and evolving ecosystem developments.