Crucial Crypto Price Analysis: BTC, ETH & Top Altcoins Market Outlook

Navigating the volatile cryptocurrency market can feel like charting unknown waters. Recent price fluctuations have left many traders wondering: Is this a temporary dip or the start of a deeper correction? In this comprehensive crypto price analysis, we dissect the movements of Bitcoin (BTC), Ethereum (ETH), and a selection of top altcoins including XRP, BNB, SOL, ADA, DOGE, PI, LEO, and HBAR. We’ll explore critical support and resistance levels, analyze market indicators, and provide insights to help you make informed decisions in today’s dynamic crypto landscape. Is a bottom near, or should we brace for further downside? Let’s dive into the charts and uncover the potential paths forward for these leading cryptocurrencies.
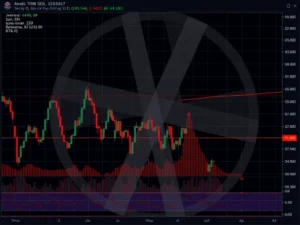
Bitcoin Price Analysis: Is a Bottom Finally in Sight?
Bitcoin (BTC) experienced a bounce from $76,606 on March 11th, offering a glimmer of hope to bulls. However, the upward momentum faced immediate selling pressure near the $85,000 mark on March 12th. Despite this resistance, there are emerging indications that selling pressure might be waning, suggesting a potential bottom could be forming.
According to Aurelie Barthere, Principal Research Analyst at Nansen, Bitcoin’s current price action is characteristic of a “macro correction within a bull market.” Barthere identifies the critical level to watch as the “$71,000-$72,000 range,” which represents the peak of the pre-election trading range. This perspective aligns with Glassnode’s market report from March 11th, which also points to a similar target. Glassnode attributes the recent sell-off to short-term holders who likely entered the market near the January peak. Their analysis suggests that if selling persists, Bitcoin could find a bottom around the $70,000 level.
Interestingly, the broader financial markets are also exhibiting similar pressures. The US stock market has faced headwinds in recent days. However, a potential silver lining for crypto bulls emerges from the US Dollar Index (DXY). The DXY has corrected from its multi-year high above 110 to below 104. Historically, Bitcoin and the dollar have often shown an inverse correlation. This DXY correction could suggest that a market bottom for Bitcoin and potentially other cryptocurrencies is indeed approaching.
Key Bitcoin Price Levels to Watch:
- Support: $76,606, $73,777, $67,000
- Resistance: $84,500, 20-day EMA ($87,262), 50-day SMA ($94,654)
Technically, Bitcoin’s chart reveals a break below the $78,258 level on March 10th, followed by a drop to $76,606 on March 11th. The inability of bears to sustain prices at these lower levels indicates significant buying interest. The current relief rally is encountering resistance at the 20-day exponential moving average (EMA), currently around $87,262. However, a positive divergence on the Relative Strength Index (RSI) offers a minor bullish signal.
For the correction to be confidently declared over, bulls need to push the price above the 20-day EMA. Success here could pave the way for a move towards the 50-day simple moving average (SMA) at $94,654. Conversely, failure to hold $73,777 could trigger a deeper decline towards $67,000.
Ethereum Price Analysis: Will ETH Bulls Defend Key Support?
Ethereum (ETH) experienced a breakdown below the crucial $1,993 support level on March 9th, accelerating its decline to reach $1,754 on March 11th. Currently, bulls are attempting to initiate a recovery. However, this recovery is likely to encounter substantial resistance at the former support level of $2,111, which is now expected to act as resistance.
A sharp rejection from $2,111 would confirm the bears’ successful flip of this level into resistance, increasing the probability of a further breakdown below $1,754. Such a move could trigger a deeper slide towards $1,500.
On the other hand, a decisive break above the 20-day EMA, currently at $2,235, would signal a rejection of the breakdown below $2,111. This bullish scenario could propel ETH towards $2,800, where bears are anticipated to mount significant resistance.
Key Ethereum Price Levels to Watch:
- Resistance: $2,111, 20-day EMA ($2,235), $2,800
- Support: $1,754, $1,500
Altcoin Price Analysis: Decoding Market Trends for XRP, BNB, SOL, ADA, DOGE, PI, LEO, HBAR
Beyond Bitcoin and Ethereum, understanding the market trends for altcoins is crucial for a holistic view of the crypto landscape. Let’s examine the price action of several prominent altcoins:
XRP (XRP)
XRP briefly dipped below the $2 support on March 11th, but the emergence of a long tail on the candlestick suggests that lower prices were quickly bought up. Bears are currently attempting to cap the recovery at the 20-day EMA ($2.35). Failure to overcome this EMA could lead to a retest and potential break below $2, completing a bearish head-and-shoulders pattern. Minor support exists at $1.77, but a break below this level could trigger a deeper correction towards $1.28. Conversely, a break above the 20-day EMA could propel XRP towards the 50-day SMA ($2.58) and potentially $3.
BNB (BNB)
BNB rebounded from $507 on March 11th, indicating strong bullish defense of the $500-$460 support zone. The current relief rally is expected to face resistance at the 20-day EMA ($592). A rejection at this EMA could lead to a retest of the $500 support, with a potential breakdown towards $460. However, a break above the 20-day EMA would suggest BNB might consolidate within the $460-$745 range for a longer period. Bulls would regain a stronger position on a break and close above the 50-day SMA ($628).
Solana (SOL)
Solana bounced from $112 on March 11th, signaling robust defense of the $110 support level. The RSI is showing early signs of positive divergence, suggesting weakening bearish momentum. A break and close above the 20-day EMA ($145) would be the first sign of strengthening bullish momentum. However, rejection at the current level or the 20-day EMA would indicate continued selling pressure on rallies, increasing the risk of a break below $110. A breakdown could lead to a decline towards $98 and potentially $80.
Cardano (ADA)
Cardano rebounded off its uptrend line on March 11th, suggesting bulls are attempting to halt the decline. However, bears are expected to defend the moving averages. Rejection at these moving averages would signal continued selling pressure on rallies, and bears would then aim to break below the uptrend line. A successful breakdown could trigger a decline towards $0.60 and then $0.50. Conversely, a break and close above the moving averages would indicate a return of bullish momentum, potentially leading to a rally towards $1.02.
Dogecoin (DOGE)
Dogecoin continued its downtrend, reaching the $0.14 support on March 11th. Bulls are attempting to defend this level but are likely to face selling pressure at higher levels. Rejection at the 20-day EMA ($0.20) would reinforce negative sentiment and suggest continued selling on rallies, increasing the risk of a break below $0.14 and a potential fall towards $0.10. A break and close above the 20-day EMA would indicate weakening bearish control and could lead to a rally towards the 50-day SMA ($0.25), which is expected to present significant resistance.
Pi (PI)
Pi is finding support at the 61.8% Fibonacci retracement level of $1.20, indicating buying interest at lower prices. The relief rally is expected to encounter resistance at the 20-day EMA ($1.69) and then again at $2. Rejection at these resistance levels could confine PI to a range between $2 and $1.20 for some time. A break and close above $2 would suggest the correction is over, potentially leading to a rally towards $2.40. Conversely, a break and close below $1.20 could trigger a deeper decline towards the 78.6% retracement level of $0.72.
UNUS SED LEO (LEO)
UNUS SED LEO has been consolidating just below $10 for several days, suggesting bulls are holding their positions in anticipation of a further upward move. LEO has formed an ascending triangle pattern, which would be completed on a break and close above $10. Such a breakout could resume the uptrend towards the target objective of $12.04. This bullish outlook would be invalidated by a break below the uptrend line, which could trigger a decline towards $8.84 and then $8.30.
Hedera (HBAR)
Hedera bounced from the $0.17 support on March 11th, indicating strong bullish defense of this level. The recovery is facing resistance at the 20-day EMA ($0.22), as evidenced by the long wick on the candlestick. Continued downward pressure could lead to another attempt by bears to break below $0.17, potentially triggering a plunge towards $0.12. However, a break above the 20-day EMA would suggest weakening selling pressure and could lead to a rally towards the downtrend line, a crucial level to watch. A break above the downtrend line could propel HBAR towards $0.29.
Conclusion: Navigating Crypto Market Volatility
The cryptocurrency market remains in a state of flux. While Bitcoin and several altcoins have shown signs of recovery from recent dips, significant resistance levels loom overhead. Market trends suggest a potential bottom may be forming, but further confirmation is needed. Traders should closely monitor the key support and resistance levels outlined in this crypto price analysis and exercise caution. Remember, this analysis is for informational purposes only and not financial advice. Always conduct thorough research and understand the risks involved before making any investment decisions in the cryptocurrency market.
Disclaimer: This article does not contain investment advice or recommendations. Every investment and trading move involves risk, and readers should conduct their own research when making a decision.